. 2021 Jan 19;17(1):e1009241.
doi: 10.1371/journal.pgen.1009241. eCollection 2021 Jan.

Estimating FST and kinship for arbitrary population structures

Affiliations

Estimating FST and kinship for arbitrary population structures

Alejandro Ochoa et al. PLoS Genet. .

Abstract

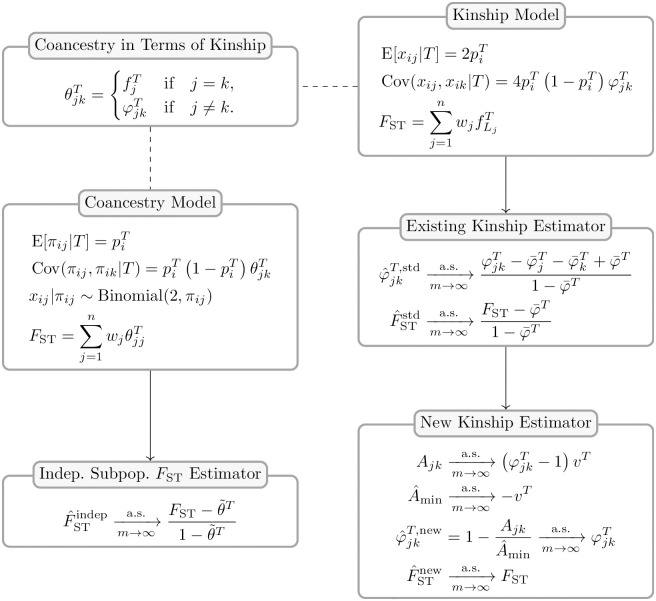
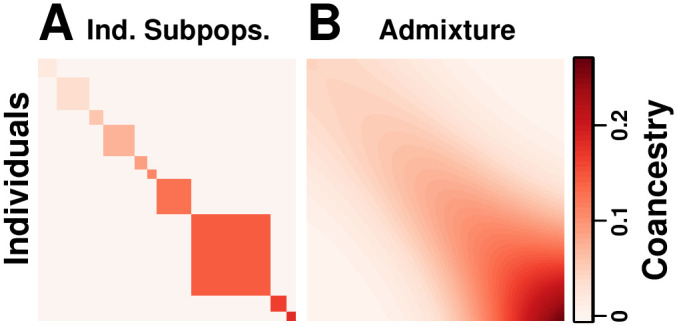
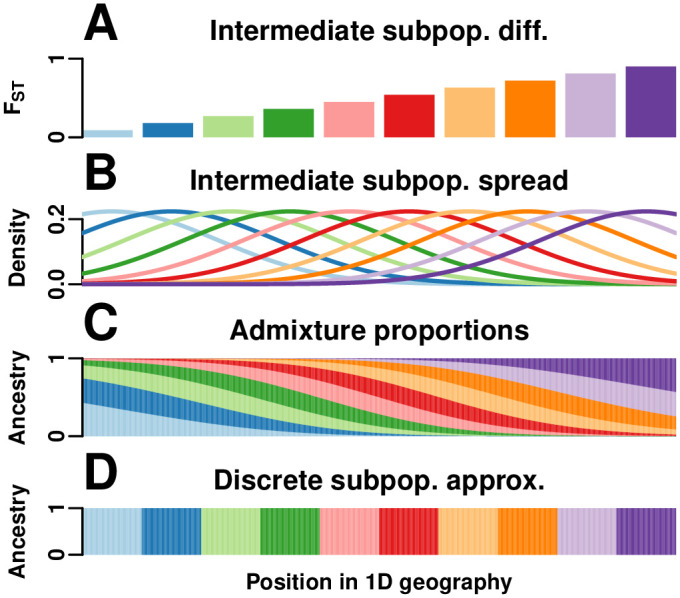
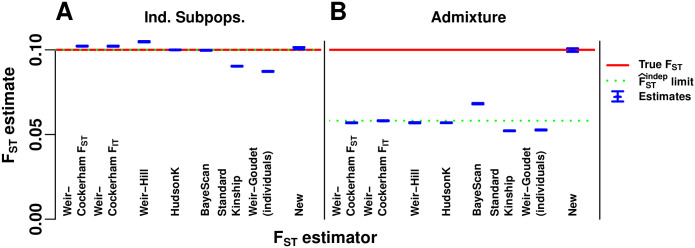
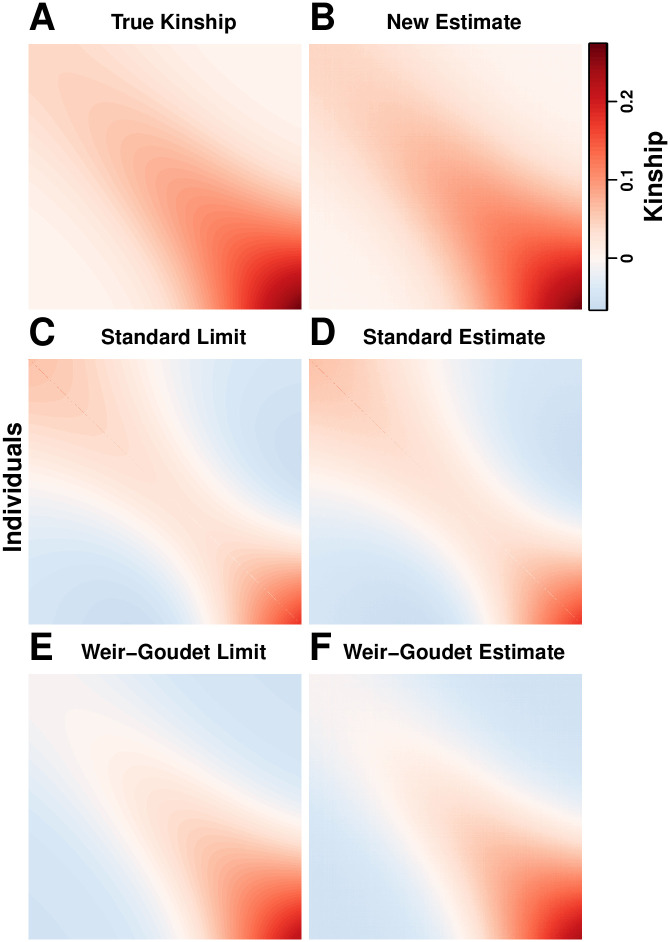
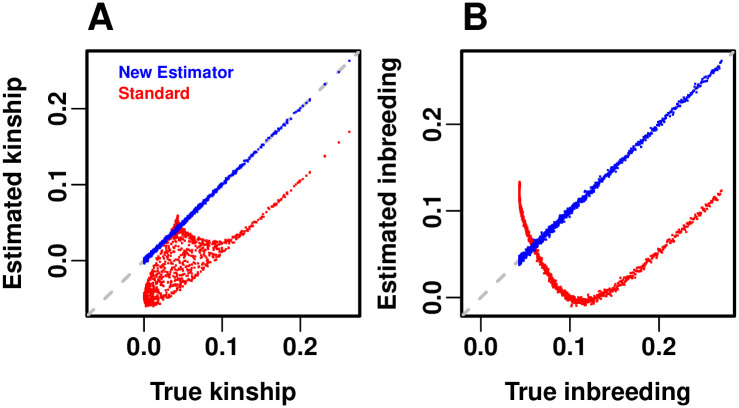
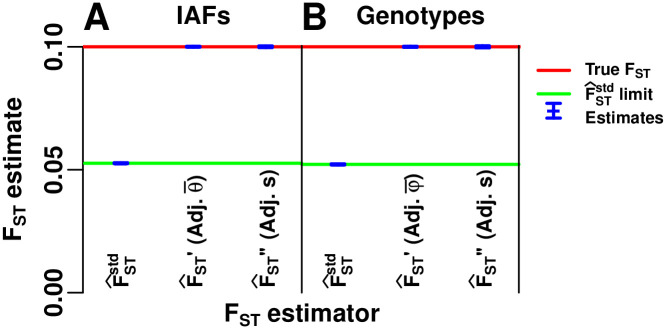
FST and kinship are key parameters often estimated in modern population genetics studies in order to quantitatively characterize structure and relatedness. Kinship matrices have also become a fundamental quantity used in genome-wide association studies and heritability estimation. The most frequently-used estimators of FST and kinship are method-of-moments estimators whose accuracies depend strongly on the existence of simple underlying forms of structure, such as the independent subpopulations model of non-overlapping, independently evolving subpopulations. However, modern data sets have revealed that these simple models of structure likely do not hold in many populations, including humans. In this work, we analyze the behavior of these estimators in the presence of arbitrarily-complex population structures, which results in an improved estimation framework specifically designed for arbitrary population structures. After generalizing the definition of FST to arbitrary population structures and establishing a framework for assessing bias and consistency of genome-wide estimators, we calculate the accuracy of existing FST and kinship estimators under arbitrary population structures, characterizing biases and estimation challenges unobserved under their originally-assumed models of structure. We then present our new approach, which consistently estimates kinship and FST when the minimum kinship value in the dataset is estimated consistently. We illustrate our results using simulated genotypes from an admixture model, constructing a one-dimensional geographic scenario that departs nontrivially from the independent subpopulations model. Our simulations reveal the potential for severe biases in estimates of existing approaches that are overcome by our new framework. This work may significantly improve future analyses that rely on accurate kinship and FST estimates.


Conflict of interest statement

The authors have declared that no competing interests exist.

Figures

Fig 1
Fig 1. Accuracy of FST and kinship estimators: Overview of models and results.
Our analysis is based on the generalized FST definition (section The generalized FST for arbitrary population structures) and two parallel models: the “Coancestry Model” for individual-specific allele frequencies (πij), and the “Kinship Model” for genotypes (xij). The “Coancestry in Terms of Kinship” panel connects kinship (φjkT, fjT) and coancestry (θjkT) parameters (section The kinship and coancestry models). We use these models to study the accuracy of FST and kinship method-of-moment estimators under arbitrary population structures. The “Indep. Subpop. FST Estimator” panel shows the bias resulting from the misapplication of FST estimators for independent subpopulations (F^STindep) to arbitrary structures (section FST estimation based on the independent subpopulations model), as calculated under the coancestry model. The “Existing Kinship Estimator” panel shows the bias in the standard kinship model estimator (φ^jkT,std) and its resulting plug-in FST estimator (F^STstd; section Characterizing a kinship estimator and its relationship to FST), as calculated under the kinship model. The “New Kinship Estimator” panel presents a new statistic Ajk that estimates kinship with a uniform bias, which together with a consistent estimator of its minimum value (A^min) results in our new kinship (φ^jkT,new) and FST (F^STnew) estimators, which are consistent under arbitrary population structure (section A new approach for kinship and FST estimation).
Fig 2
Fig 2. Coancestry matrices of simulations.
Both panels have n = 1000 individuals along both axes, K = 10 subpopulations (final or intermediate), and FST = 0.1. Color corresponds to θjkT between individuals j and k (equal to φjkT off-diagonal, fjT along the diagonal). (A) The independent subpopulations model has θjkT=0 between subpopulations, and varying θjjT per subpopulation, resulting in a block-diagonal coancestry matrix. (B) Our admixture scenario models a 1D geography with extensive admixture and intermediate subpopulation differentiation that increases with distance, resulting in a smooth coancestry matrix with no independent subpopulations (no θjkT=0 between blocks). Individuals are ordered along each axis by geographical position.
Fig 3
Fig 3. 1D admixture scenario.
We model a 1D geography population that departs strongly from the independent subpopulations model. (A) K = 10 intermediate subpopulations, evenly spaced on a line, evolved independently in the past with FST increasing with distance, which models a sequence of increasing founder effects (from left to right) to mimic the global human population. (B) Once differentiated, individuals in these intermediate subpopulations spread by random walk modeled by Normal densities. (C) n = 1000 individuals, sampled evenly in the same geographical range, are admixed proportionally to the previous Normal densities. Thus, each individual draws most of its alleles from the closest intermediate subpopulation, and draws the fewest alleles from the most distant populations. Long-distance random walks of intermediate subpopulation individuals results in kinship for admixed individuals that decays smoothly with distance in Fig 2B. (D) For FST estimators that require a partition of individuals into subpopulations, individuals are clustered by geographical position (K = 10).
Fig 4
Fig 4. Evaluation of FST estimators.
The Weir-Cockerham, Weir-Hill, Weir-Goudet (for individuals), HudsonK (equal to Weir-Goudet for subpopulations, S1 Text), BayeScan, F^STstd in Eq (25) derived from the standard kinship estimator, and our new FST estimator in Eqs (34) and (37), are evaluated on simulated genotypes from our two models (Fig 2). The Weir-Cockerham FIT estimator was also included to show that estimation of total inbreeding behaves similarly to FST estimators. (A) The independent subpopulations model required by the Weir-Hill, HudsonK, and BayeScan FST estimators. All but standard kinship (F^STstd) and Weir-Goudet (for individuals) recover the target FST IBD probability in Eq (9) (red line) with small errors. (B) Our admixture scenario, which has no independent subpopulations, was constructed so F^STstd12FST. Only our new estimates are accurate. The rest of these estimators give values smaller than the target FST IBD probability, which result from treating kinship as zero between every subpopulations imposed by geographic clustering (or between individuals for Standard Kinship and Weir-Goudet). The F^STindep estimator limit in Eq (14) (green dotted line) overlaps the true FST (red line) in (A) but not (B). Estimates (blue) include 95% prediction intervals (often too narrow to see) from 39 independently-simulated genotype matrices for each model (Methods, section Prediction intervals).
Fig 5
Fig 5. Evaluation of kinship estimators.
Observed accuracy for two existing kinship coefficient estimators is illustrated in our admixture simulation and contrasted to the nearly unbiased estimates of our new estimator. Plots show n = 1000 individuals along both axes, and color corresponds to φjkT between individuals jk and to fjT along the diagonal (fjT is in the same scale as φjkT for jk; plotting φjjT, which have a minimum value of 12, would result in a discontinuity in this figure). (A) True kinship matrix. (B) Estimated kinship using our new estimator in Eqs (34) and (37) from simulated genotypes recovers the true kinship matrix with high accuracy. (C) Theoretical limit of φ^jkT,std in Eq (19) as the number of independent loci goes to infinity demonstrates the accuracy of our bias predictions under the kinship model. (D) Standard kinship estimates φ^jkT,std given by Eq (18) from simulated genotypes are downwardly biased on average and distorted by pair-specific amounts. (E) Theoretical limit of the Weir-Goudet kinship estimator given by Eq (38). (F) Weir-Goudet kinship estimates from the same simulated genotypes agree with our calculated limit.
Fig 6
Fig 6. Accuracy of kinship estimators.
Here the estimated kinship values are directly compared to their true values, in the same admixture simulation data (n = 1000 individuals) shown in the previous figure. (A) Kinship between different individuals (excluding inbreeding). The new estimator has practically no bias in this evaluation (falls on the 1-1 dashed gray line). The standard estimator has a complex, non-linear bias that covers a large area of errors. (B) Inbreeding comparison, shows the bias of the standard estimate follows a different pattern for inbreeding compared to kinship between individuals. To better visualize and compare data across panels, a random subset of n points (out of the original n(n − 1)/2 unique individual pairs) were plotted in (A), matching the number of individuals (number of points in (B)).
Fig 7
Fig 7. Evaluation of standard and adjusted FST estimators.
The convergence values we calculated for the standard kinship plug-in and adjusted FST estimators are validated using our admixture simulation. All adjusted estimators are unbiased but are “oracle” methods, since the mean kinship (φ¯T), mean coancestry (θ¯T), or bias coefficient (sT=θ¯TFST for IAFs, replaced by φ¯TFST for genotypes) are usually unknown. (A) Estimation from individual-specific allele frequencies (IAFs): F^STstd is the standard coancestry plug-in estimator in Eq (26); F^ST “Adj. θ¯T” is in Eq (27); F^ST “Adj. s” is in Eq (31). (B) For genotypes, F^STstd is given in Eq (25), and the adjusted estimators use φ¯T rather than θ¯T. Lines: true FST (red line), limits of biased estimators F^STstd (green lines, which differ slightly per panel). Estimates (blue) include 95% prediction intervals (too narrow to see) from 39 independently-simulated genotype matrices for our admixture model (Methods, section Prediction intervals).

References

    1. Malécot G. Mathématiques de l’hérédité. Masson et Cie; 1948.
    1. Wright S. The genetical structure of populations. Ann Eugen. 1951;15(4):323–354. - PubMed
    1. Balding DJ, Nichols RA. A method for quantifying differentiation between populations at multi-allelic loci and its implications for investigating identity and paternity. Genetica. 1995;96(1-2):3–12. 10.1007/BF01441146 - DOI - PubMed
    1. Weir BS, Hill WG. Estimating F-Statistics. Annual Review of Genetics. 2002;36(1):721–750. 10.1146/annurev.genet.36.050802.093940 - DOI - PubMed
    1. Nicholson G, Smith AV, Jónsson F, Gústafsson O, Stefánsson K, Donnelly P. Assessing population differentiation and isolation from single-nucleotide polymorphism data. Journal of the Royal Statistical Society: Series B (Statistical Methodology). 2002;64(4):695–715. 10.1111/1467-9868.00357 - DOI

Publication types

MeSH terms

LinkOut - more resources