. 2021 Jan 19;17(1):e1009226.
doi: 10.1371/journal.ppat.1009226. eCollection 2021 Jan.

The coronavirus proofreading exoribonuclease mediates extensive viral recombination

Affiliations

The coronavirus proofreading exoribonuclease mediates extensive viral recombination

Jennifer Gribble et al. PLoS Pathog. .

Abstract

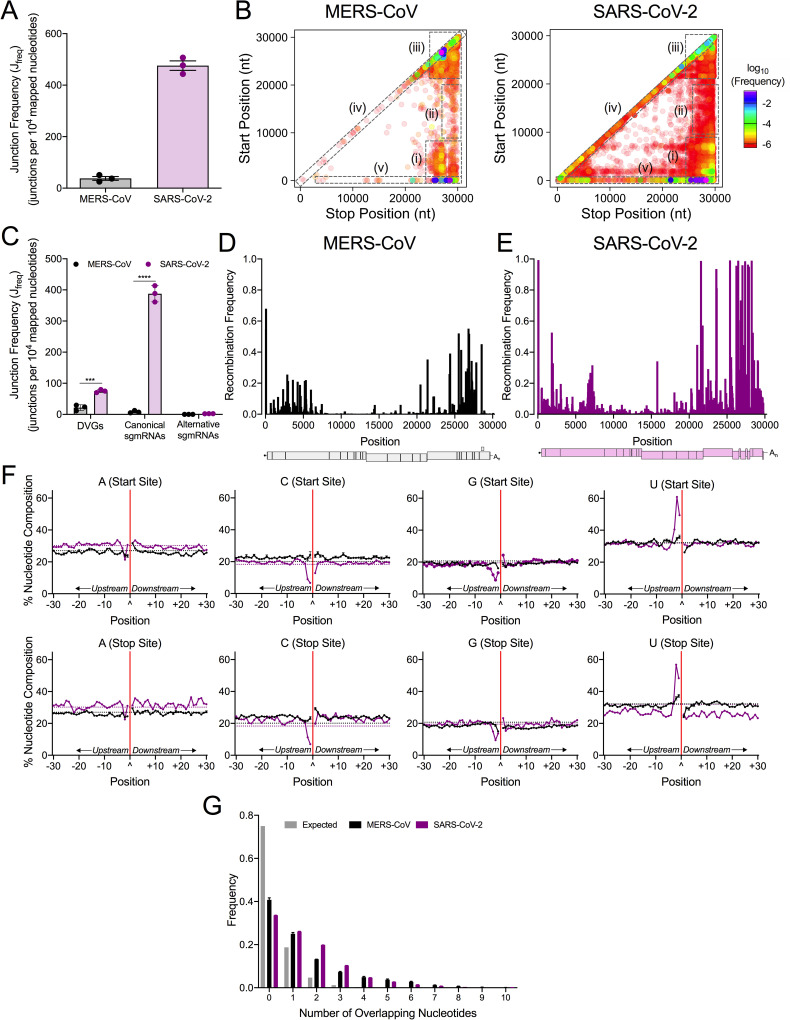
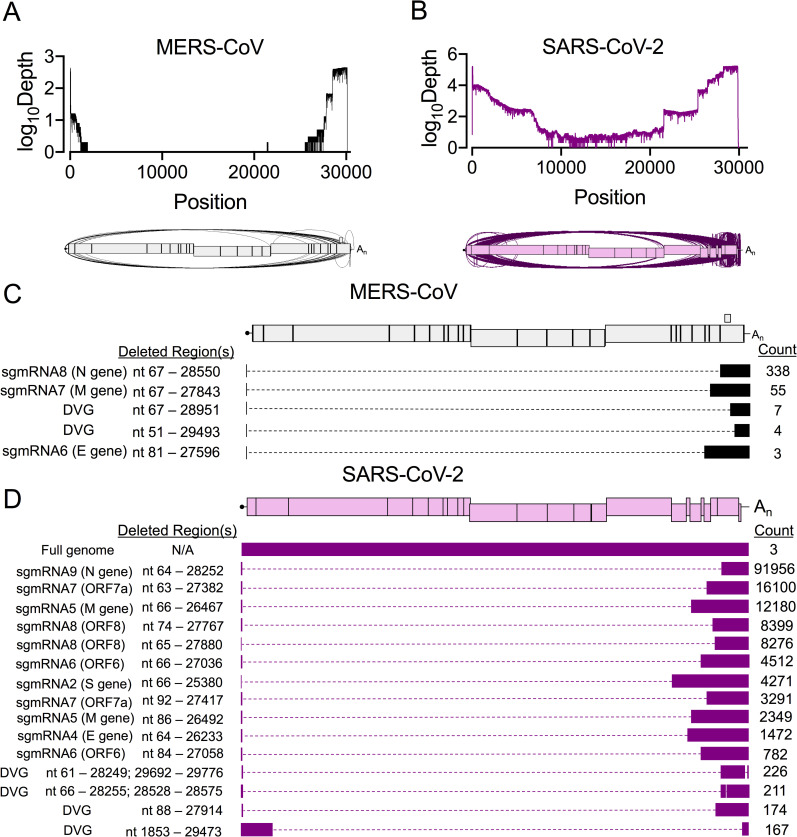
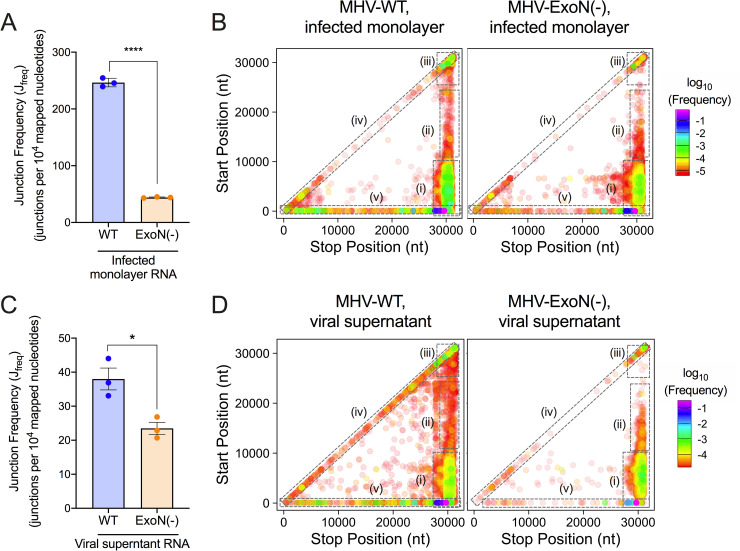
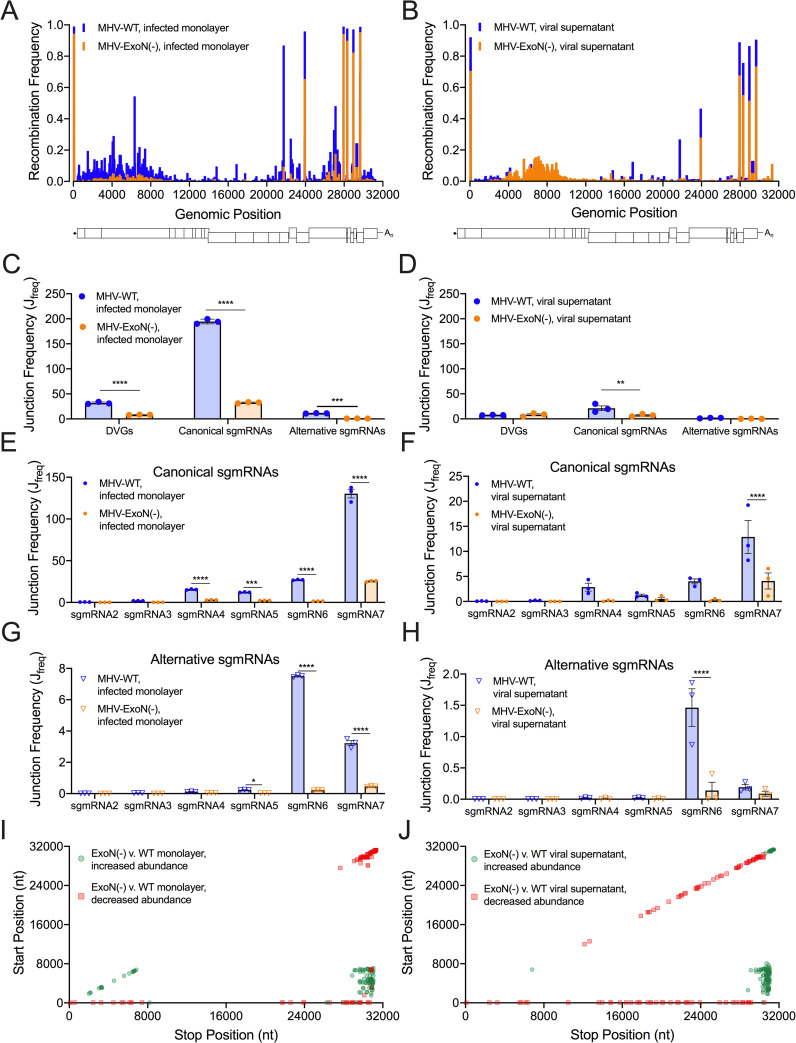
Recombination is proposed to be critical for coronavirus (CoV) diversity and emergence of SARS-CoV-2 and other zoonotic CoVs. While RNA recombination is required during normal CoV replication, the mechanisms and determinants of CoV recombination are not known. CoVs encode an RNA proofreading exoribonuclease (nsp14-ExoN) that is distinct from the CoV polymerase and is responsible for high-fidelity RNA synthesis, resistance to nucleoside analogues, immune evasion, and virulence. Here, we demonstrate that CoVs, including SARS-CoV-2, MERS-CoV, and the model CoV murine hepatitis virus (MHV), generate extensive and diverse recombination products during replication in culture. We show that the MHV nsp14-ExoN is required for native recombination, and that inactivation of ExoN results in decreased recombination frequency and altered recombination products. These results add yet another critical function to nsp14-ExoN, highlight the uniqueness of the evolved coronavirus replicase, and further emphasize nsp14-ExoN as a central, completely conserved, and vulnerable target for inhibitors and attenuation of SARS-CoV-2 and future emerging zoonotic CoVs.


Conflict of interest statement

The authors have declared that no competing interests exist.

Figures

Fig 1
Fig 1. Genome-wide recombination generates populations of diverse RNA molecules in MERS-CoV and SARS-CoV-2.
MERS-CoV total cell lysates (black) and SARS-CoV-2 infected cell monolayers (violet) were sequenced by RNA-seq. (A) Junction frequency (Jfreq) was calculated by normalizing number of nucleotides in ViReMa-detected junctions to viral RNA (total mapped nucleotides) and multiplying by 10,000 to express Jfreq as the number of junctions per 104 mapped nucleotides. Error bars represent standard errors of the mean (SEM) for three independent sequencing libraries (N = 3). (B) Recombination junctions are mapped according to their genomic position (5’ junction site, Start Position; 3’ junction site, Stop Position) and colored according to their frequency in the population of all junctions in MERS-CoV and SARS-CoV-2. The highest frequency junctions are magenta and completely opaque. The lowest frequency junctions are red and the most transparent. Dashed boxes represent clusters of junctions: (i) 5’ ➔ 3’; (ii) mid-genome ➔ 3’ UTR; (iii) 3’ ➔ 3’; (iv) local deletions; (v) 5’ UTR ➔ rest of genome. (C) The Jfreq of DVGs, canonical sgmRNAs, and alternative sgmRNAs was calculated and compared in MERS-CoV (black) and SARS-CoV-2 (violet). Error bars represent SEM for 3 independent sequencing libraries (N = 3) of each virus. 2-way ANOVA with multiple comparisons corrected by statistical hypothesis testing (Sidak test). *** p < 0.001, **** p < 0.0001. Mean recombination frequency is quantified at each position across the MERS-CoV (D) and SARS-CoV-2 (E) genomes (N = 3). Recombination frequency was calculated by dividing the number of nucleotides in detected junctions at that position (start and stop sites) by the total number of mapped nucleotides at the position. See also S2 Fig and S1 Table. (F) The percent adenosine (A), cytosine (C), guanine (G), and uracil (U) at each position in a 30-base pair region flanking DVG junction start and stop sites in MERS-CoV (black) and SARS-CoV-2 (violet). Each point represents a mean (N = 3) and error bars represent SEM. The junction site is denoted as a carat (^) and with a solid red line. Positions upstream from the junction are labelled -30 to -1 and positions downstream are labelled +1 to +30. The expected nucleotide percentage based on the composition of the viral genome is marked as a dashed line (black = MERS-CoV, violet = SARS-CoV-2). (G) Distribution of sequence microhomology in MERS-CoV (black) and SARS-CoV-2 (violet) compared to an expected probability distribution (gray). The frequency of each nucleotide overlap length is displayed as a mean (N = 3) and error bars represent SEM.
Fig 2
Fig 2. Direct RNA Nanopore sequencing of MERS-CoV and SARS-CoV-2 reveals accumulation of distinct recombined RNA populations.
Direct RNA Nanopore sequencing of poly-adenylated MERS-CoV and SARS-CoV-2 RNA. Three sequencing experiments were performed for each virus. Nanopore reads passing quality control were combined and mapped to the viral genome using minimap2 [70]. Genome coverage maps and Sashimi plots visualizing junctions (arcs) in full-length (A) MERS-CoV (black) and (B) SARS-CoV-2 (violet) RNA reads. (C) Distinct RNA molecules identified in MERS-CoV (black) with at least 3 supporting reads are visualized. The number of sequenced reads containing the junction is listed (Count). Genetic sequences of each RNA molecule are represented by filled boxes and deleted regions are noted (Deleted Region(s)) and represented by dashed lines. (D) The 15 most abundant SARS-CoV-2 (violet) recombined RNA molecules and 3 full-genome reads are visualized. See also S2 Table, S3 Table, S4 Table.
Fig 3
Fig 3. Loss of nsp14-ExoN activity decreases recombination frequency and alters recombination junction patterns across the genome.
Infected monolayer and viral supernatant RNA poly(A) selected, sequenced by RNA-seq, and aligned to the MHV genome using ViReMa. Junction frequency (Jfreq) in infected monolayer RNA (A) and viral supernatant RNA (C) was calculated by normalizing the number of nucleotides in ViReMa-detected junctions to total viral RNA (total mapped nucleotides) and multiplying by 10,000, expressing Jfreq as number of junctions per 104 mapped nucleotides. Error bars represent standard error of the means (SEM) (N = 3). Statistical significance was determined by the unpaired student’s t-test. * p < 0.05, **** p < 0.0001. Unique forward (5’ ➔ 3’) recombination junctions detected in infected monolayers (C) and viral supernatant (E) were mapped in MHV-WT and MHV-ExoN(-) according to their genomic position. Junctions are colored according to their frequency in the population (high frequency = magenta; low frequency = red). Clusters are marked by dashed boxes: (i) 5’ ➔ 3’; (ii) mid-genome ➔ 3’; (iii) 3’ ➔ 3’; (iv) local deletions; (v) 5’ UTR ➔ rest of genome. See also S3 and S4 Figs.
Fig 4
Fig 4. Loss of nsp14-ExoN alters recombination at multiple genomic loci and skews recombined RNA populations.
Mean recombination frequency at each position across the MHV genome was compared in MHV-WT (blue) and MHV-ExoN(-) (orange) infected monolayer (A) and viral supernatant RNA (B). 2-way ANOVA with multiple comparisons (N = 3). The junction frequencies (Jfreq) of DVGs, canonical sgmRNAs, and alternative sgmRNAs were compared in MHV-WT (blue) and MHV-ExoN(-) (orange) infected monolayers (C) and viral supernatant (D). Error bars represent standard errors of the mean (SEM) (N = 3) and statistical significance was determined by a 2-way ANOVA with multiple comparisons correct by statistical hypothesis testing (Sidak test), ** p <0.01, *** p < 0.001, **** p < 0.0001. The Jfreq of canonical sgmRNA junctions was compared in MHV-WT (blue) and MHV-ExoN(-) (orange) infected monolayers (E) and viral supernatant (F). Error bars represent SEM (N = 3). Statistical significance was determined by a 2-way ANOVA with multiple comparisons corrected by statistical hypothesis testing (Sidak test), *** p < 0.001, **** p < 0.0001. The Jfreq of alternative sgmRNA molecules was quantified for MHV-WT (blue) and MHV-ExoN(-) (orange) infected cell monolayers (G) and viral supernatant (H). Error bars represent SEM (N = 3). Statistical significance was determined by a 2-way ANOVA with multiple comparisons corrected by statistical hypothesis testing (Sidak test), * p < 0.05, **** p < 0.0001. The abundance of junctions in MHV-ExoN(-) was compared to MHV-WT in infected monolayers (I) and viral supernatant (J) by DESeq2. Junctions with statistically significant altered abundance (p < 0.05, N = 3) in MHV-ExoN(-) are mapped across the genome and colored according to their fold-change (red squares = decreased abundance, green circles = increased abundance). See also S3–S5 Figs and S5 and S6 Tables.
Fig 5
Fig 5. MHV-ExoN(-) DVG junction sites display both WT-like patterns of sequence composition and multiple alterations in nucleotide frequency, revealing microhomology at junctions.
(A) Nucleotide composition was calculated as the percent adenosine (A), cytosine (C), guanine (G), and uracil (U) at each position in a 30-base pair region flanking DVG junction start and stop sites in MHV-WT (blue) and MHV-ExoN(-) (orange) infected monolayer RNA. The junction is labelled as a carat (^) and a solid red line with upstream positions numbered -30 to -1 and downstream positions +1 to +30. The expected nucleotide percentage was calculated based on the overall MHV genome and represented as a dashed black line. Each point represents a mean (N = 3) and error bars represent SEM. 2-way ANOVA with multiple comparisons corrected for false discovery rate (FDR) by the Benjamini-Hochberg method. * q < 0.05, ** q < 0.01, *** q < 0.001, **** q < 0.0001. (B) Distribution of microhomology overlaps in MHV-WT (blue) and MHV-ExoN(-) (orange) compared to an expected probability distribution (gray). The frequency of each overlap length is displayed as a mean (N = 3) and error bars represent SEM. See also S5 Fig.
Fig 6
Fig 6. Direct RNA Nanopore sequencing of MHV full-length recombined RNA molecules.
Direct RNA Nanopore sequencing of MHV viral supernatant RNA. (A) Genome coverage maps of full-length MHV-WT (blue) and MHV-ExoN(-) (orange) Nanopore reads aligned to the MHV-A59 genome using minimap2. (B) Sashimi plot visualizing junctions (arcs) in MHV-WT (blue) and MHV-ExoN(-) (orange). (C) RNA molecule genetic architectures with at least 3 supporting reads identified in both MHV-WT and MHV-ExoN(-) (yellow) and unique to MHV-WT (blue). Genetic sequences of the RNA molecule are represented by filled boxes. Deleted regions are reported (Deleted Region) and represented by dashed lined. The number of reads supporting each species are noted (Count). See also S2 Table, S3 Table, and S4 Table.

References

    1. Wu F, Zhao S, Yu B, Chen Y-M, Wang W, Song Z-G, et al. A new coronavirus associated with human respiratory disease in China. Nature. 2020. February 3;1–5. - PMC - PubMed
    1. Patiño-Galindo JÁ, Filip I, AlQuraishi M, Rabadan R. Recombination and lineage-specific mutations led to the emergence of SARS-CoV-2. bioRxiv. 2020. March 23;2020.02.10.942748. 10.1101/2020.02.10.942748 - DOI - PMC - PubMed
    1. Huang J-M, Jan SS, Wei X, Wan Y, Ouyang S. Evidence of the Recombinant Origin and Ongoing Mutations in Severe Acute Respiratory Syndrome Coronavirus 2 (SARS-CoV-2). bioRxiv. 2020. March 19;2020.03.16.993816.
    1. Li X, Giorgi EE, Marichann MH, Foley B, Xiao C, Kong X, et al. Emergence of SARS-CoV-2 through Recombination and Strong Purifying Selection. bioRxiv. 2020. March 24;2020.03.20.000885. - PMC - PubMed
    1. Yi H. 2019 novel coronavirus is undergoing active recombination. Clin Infect Dis [Internet]. 2020. [cited 2020 Mar 11]; Available from: https://academic.oup.com/cid/advance-article/doi/10.1093/cid/ciaa219/578... - DOI - PMC - PubMed

Publication types

MeSH terms