

Impact of prolonged sepsis on neural and muscular components of muscle contractions in a mouse model
- PMID: 33465304
- PMCID: PMC8061378
- DOI: 10.1002/jcsm.12668
Impact of prolonged sepsis on neural and muscular components of muscle contractions in a mouse model
Abstract
Background: Prolonged critically ill patients frequently develop debilitating muscle weakness that can affect both peripheral nerves and skeletal muscle. In-depth knowledge on the temporal contribution of neural and muscular components to muscle weakness is currently incomplete.
Methods: We used a fluid-resuscitated, antibiotic-treated, parenterally fed murine model of prolonged (5 days) sepsis-induced muscle weakness (caecal ligation and puncture; n = 148). Electromyography (EMG) measurements were performed in two nerve-muscle complexes, combined with histological analysis of neuromuscular junction denervation, axonal degeneration, and demyelination. In situ muscle force measurements distinguished neural from muscular contribution to reduced muscle force generation. In myofibres, imaging and biomechanics were combined to evaluate myofibrillar contractile calcium sensitivity, sarcomere organization, and fibre structural properties. Myosin and actin protein content and titin gene expression were measured on the whole muscle.
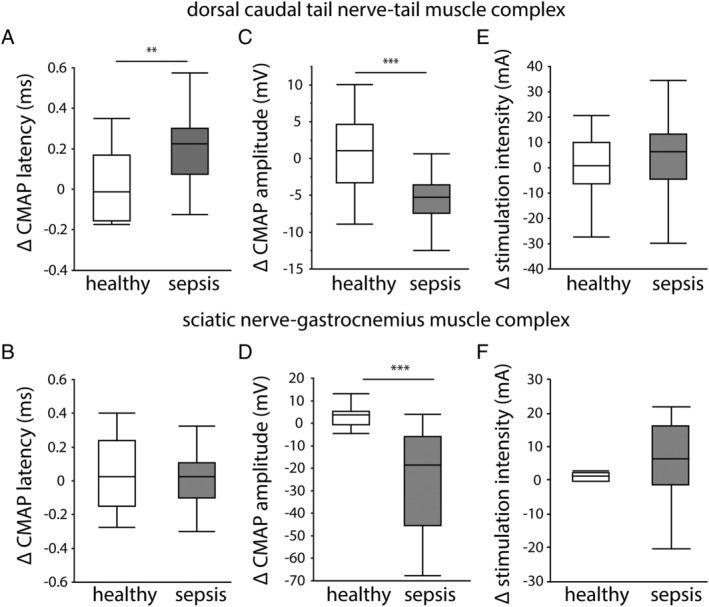
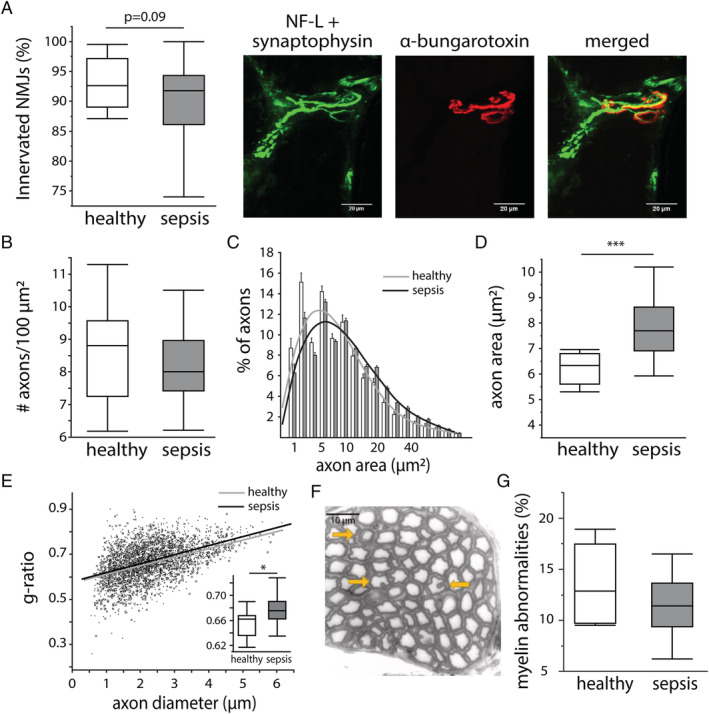
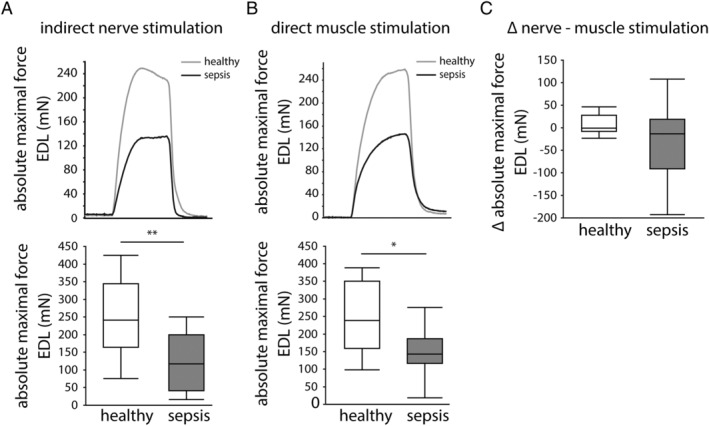
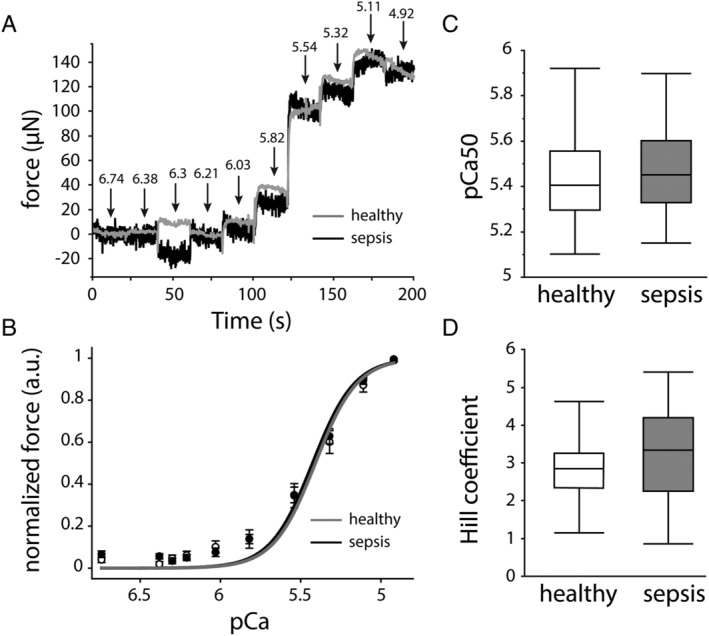
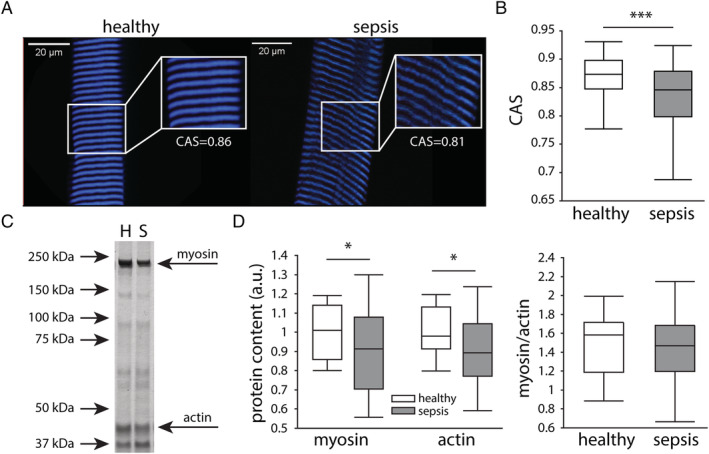
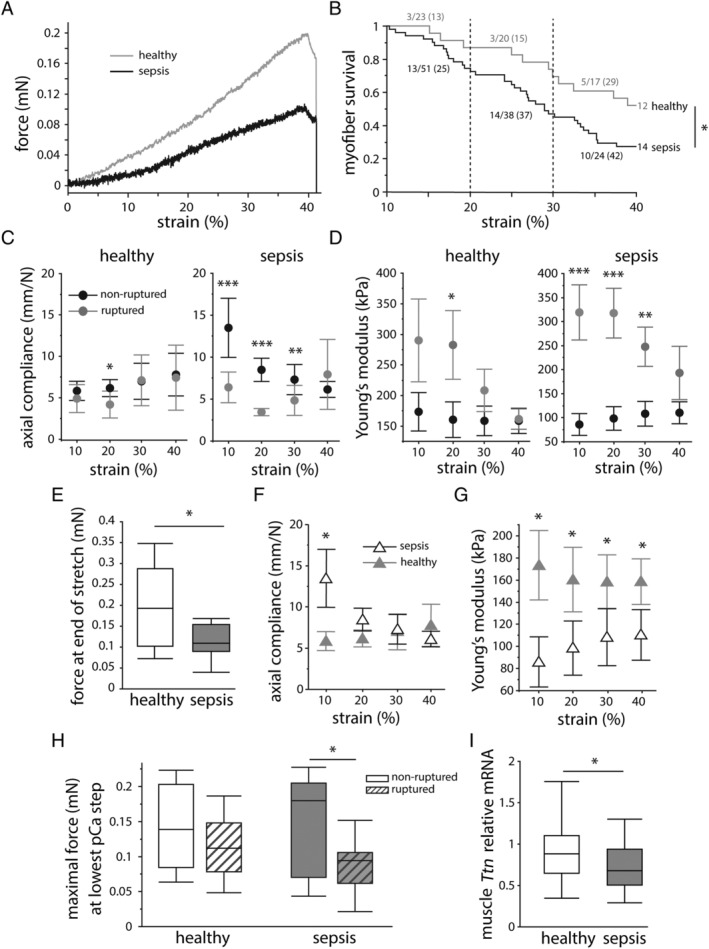
Results: Five days of sepsis resulted in increased EMG latency (P = 0.006) and decreased EMG amplitude (P < 0.0001) in the dorsal caudal tail nerve-tail complex, whereas only EMG amplitude was affected in the sciatic nerve-gastrocnemius muscle complex (P < 0.0001). Myelin sheath abnormalities (P = 0.2), axonal degeneration (number of axons; P = 0.4), and neuromuscular junction denervation (P = 0.09) were largely absent in response to sepsis, but signs of axonal swelling [higher axon area (P < 0.0001) and g-ratio (P = 0.03)] were observed. A reduction in maximal muscle force was present after indirect nerve stimulation (P = 0.007) and after direct muscle stimulation (P = 0.03). The degree of force reduction was similar with both stimulations (P = 0.2), identifying skeletal muscle, but not peripheral nerves, as the main contributor to muscle weakness. Myofibrillar calcium sensitivity of the contractile apparatus was unaffected by sepsis (P ≥ 0.6), whereas septic myofibres displayed disorganized sarcomeres (P < 0.0001) and altered myofibre axial elasticity (P < 0.0001). Septic myofibres suffered from increased rupturing in a passive stretching protocol (25% more than control myofibres; P = 0.04), which was associated with impaired myofibre active force generation (P = 0.04), linking altered myofibre integrity to function. Sepsis also caused a reduction in muscle titin gene expression (P = 0.04) and myosin and actin protein content (P = 0.05), but not the myosin-to-actin ratio (P = 0.7).
Conclusions: Prolonged sepsis-induced muscle weakness may predominantly be related to a disruption in myofibrillar cytoarchitectural structure, rather than to neural abnormalities.
Keywords: Biomechanics; Muscle contraction; Muscle weakness; Neuropathy; Sepsis.
© 2021 The Authors. Journal of Cachexia, Sarcopenia and Muscle published by John Wiley & Sons Ltd on behalf of the Society on Sarcopenia, Cachexia and Wasting Disorders.
Conflict of interest statement
The authors have nothing to disclose.
Figures
Similar articles
-
Reduced motor neuron excitability is an important contributor to weakness in a rat model of sepsis.Exp Neurol. 2016 Aug;282:1-8. doi: 10.1016/j.expneurol.2016.04.020. Epub 2016 Apr 24. Exp Neurol. 2016. PMID: 27118372 Free PMC article.
-
Adipose tissue protects against sepsis-induced muscle weakness in mice: from lipolysis to ketones.Crit Care. 2019 Jul 1;23(1):236. doi: 10.1186/s13054-019-2506-6. Crit Care. 2019. PMID: 31262340 Free PMC article.
-
Neuromuscular junction instability and altered intracellular calcium handling as early determinants of force loss during unloading in humans.J Physiol. 2021 Jun;599(12):3037-3061. doi: 10.1113/JP281365. Epub 2021 May 19. J Physiol. 2021. PMID: 33881176 Free PMC article.
-
Fast skeletal muscle troponin activator CK-2066260 mitigates skeletal muscle weakness independently of the underlying cause.J Cachexia Sarcopenia Muscle. 2020 Dec;11(6):1747-1757. doi: 10.1002/jcsm.12624. Epub 2020 Sep 21. J Cachexia Sarcopenia Muscle. 2020. PMID: 32954682 Free PMC article.
-
Muscular effects in late polio.Acta Physiol Scand. 2001 Mar;171(3):335-40. doi: 10.1046/j.1365-201x.2001.00836.x. Acta Physiol Scand. 2001. PMID: 11412146 Review.
Cited by
-
SEMPAI: a Self-Enhancing Multi-Photon Artificial Intelligence for Prior-Informed Assessment of Muscle Function and Pathology.Adv Sci (Weinh). 2023 Oct;10(28):e2206319. doi: 10.1002/advs.202206319. Epub 2023 Aug 15. Adv Sci (Weinh). 2023. PMID: 37582656 Free PMC article.
-
A scoping review of preclinical intensive care unit-acquired weakness models.Front Physiol. 2024 Oct 2;15:1423567. doi: 10.3389/fphys.2024.1423567. eCollection 2024. Front Physiol. 2024. PMID: 39416383 Free PMC article.
-
Vitamin D Promotes Remyelination by Suppressing c-Myc and Inducing Oligodendrocyte Precursor Cell Differentiation after Traumatic Spinal Cord Injury.Int J Biol Sci. 2022 Aug 29;18(14):5391-5404. doi: 10.7150/ijbs.73673. eCollection 2022. Int J Biol Sci. 2022. PMID: 36147469 Free PMC article.
-
Redox Balance Differentially Affects Biomechanics in Permeabilized Single Muscle Fibres-Active and Passive Force Assessments with the Myorobot.Cells. 2022 Nov 22;11(23):3715. doi: 10.3390/cells11233715. Cells. 2022. PMID: 36496975 Free PMC article.
-
Prolonged sepsis triggers abnormal mitochondrial dynamics in the limb muscles and diaphragm.Mol Cell Biochem. 2025 Jul 1. doi: 10.1007/s11010-025-05338-4. Online ahead of print. Mol Cell Biochem. 2025. PMID: 40591175
References
-
- Fletcher SN, Kennedy DD, Ghosh IR, Misra VP, Kiff K, Coakley JH, et al. Persistent neuromuscular and neurophysiologic abnormalities in long‐term survivors of prolonged critical illness. Crit Care Med 2003;31:1012–1016. - PubMed
-
- Bednarik J, Lukas Z, Vondracek P. Critical illness polyneuromyopathy: the electrophysiological components of a complex entity. Intensive Care Med 2003;29:1505–1514. - PubMed
-
- Koch S, Spuler S, Deja M, Bierbrauer J, Dimroth A, Behse F, et al. Critical illness myopathy is frequent: accompanying neuropathy protracts ICU discharge. J Neurol Neurosurg Psychiatry 2011;82:287–293. - PubMed
Publication types
MeSH terms
LinkOut - more resources
Full Text Sources
Other Literature Sources
Medical
