Clinical Trial
. 2021 Jan 5;10(1):71.
doi: 10.3390/cells10010071.

Linking the Endocannabinoidome with Specific Metabolic Parameters in an Overweight and Insulin-Resistant Population: From Multivariate Exploratory Analysis to Univariate Analysis and Construction of Predictive Models

Affiliations
Clinical Trial

Linking the Endocannabinoidome with Specific Metabolic Parameters in an Overweight and Insulin-Resistant Population: From Multivariate Exploratory Analysis to Univariate Analysis and Construction of Predictive Models

Clara Depommier et al. Cells. .

Abstract

The global obesity epidemic continues to rise worldwide. In this context, unraveling new interconnections between biological systems involved in obesity etiology is highly relevant. Dysregulation of the endocannabinoidome (eCBome) is associated with metabolic complications in obesity. This study aims at deciphering new associations between circulating endogenous bioactive lipids belonging to the eCBome and metabolic parameters in a population of overweight or obese individuals with metabolic syndrome. To this aim, we combined different multivariate exploratory analysis methods: canonical correlation analysis and principal component analysis, revealed associations between eCBome subsets, and metabolic parameters such as leptin, lipopolysaccharide-binding protein, and non-esterified fatty acids (NEFA). Subsequent construction of predictive regression models according to the linear combination of selected endocannabinoids demonstrates good prediction performance for NEFA. Descriptive approaches reveal the importance of specific circulating endocannabinoids and key related congeners to explain variance in the metabolic parameters in our cohort. Analysis of quartiles confirmed that these bioactive lipids were significantly higher in individuals characterized by important levels for aforementioned metabolic variables. In conclusion, by proposing a methodology for the exploration of large-scale data, our study offers additional evidence of the existence of an interplay between eCBome related-entities and metabolic parameters known to be altered in obesity.

Trial registration: ClinicalTrials.gov NCT02637115.

Keywords: LBP; NEFA; endocannabinoidome; endocannabinoids; human; leptin; metabolic syndrome; multivariate analysis; obesity.


Conflict of interest statement

P.D.C. is co-founder of A-Mansia Biotech SA. The other authors declare no conflict of interest.

Figures

Figure 1
Figure 1
Unsupervised exploration of the relationship between measured eCB system-related mediators and biological parameters using regularized canonical correlation (rCCA) and correlation matrix. (A) Correlation circle plot allocating biological parameters and eCBome features along the main components derived from the integration of both data sets. The components correspond to the equiangular vector between x- and y-variates. The features in the area outside the inner concentric circle (radius < 0.5) were retained as significant and shown in the scatter plot. (B) Relevance network of top correlations between biological parameters (circles) and eCBome lipids (rectangles) with a cut-off = 0.55. Lines are colored according to the strength of the association score between two variables with red showing positive correlations. (C) Correlation matrix (Spearman with Holm’s adjustment); positive correlations are displayed in blue and negative correlations in red color. The color intensity and the size of the circle are proportional to the correlation coefficients. “X” refers to the first data set, the metabolic biological parameters while “Y” refers to the second data set, the endocannabinoids. Abbreviations: see Table 1.
Figure 2
Figure 2
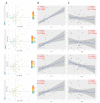
Deeper exploration of the relationship between measured eCB-related mediators and the biological parameters selected from rCCA using PCA. (A) Individual plots, the color gradient for each individual was established according to the concentration of the referred biological variable. (B) Scatterplots showing the linear relation between first principal components and the referred variable. (C) Scatterplots showing the linear relation between second principal components and the metabolic variable. The confidence interval is displayed in grey around the mean. (B,C) Each linear regression plot is accompanied by the R square, the p value and the coefficient of correlation (Pearson). Abbreviations: see Table 1.
Figure 3
Figure 3
Modeling and validation of variable response according to a selected subset of the eCBome. (A,B) PLSR correlation plot between predicted and measured NEFA levels according to the selected eCBome mediator subset, illustrating the predictive quality of NEFA in the (A) training group (n = 26) and (B) the test group (n = 6). (C) PLSR correlation plot between predicted and measured leptin according to the selected eCBome mediator subset, constructed on all observations without cross-validation (n = 32). (D) Scale plot illustrating the lw, rc, smc, sr and vip for each of the eCBome predictors in the variable-response prediction model. (E) PLSR correlation plot between predicted and measured LBP according to the selected eCBs mediator subset, construct on all observations without cross-validation (n = 32). (F) Scale plot illustrating the lw, rc, smc, sr, and vip for each of the eCBs predictors in the variable-response prediction model. (A,C,E) The black line illustrated a perfect correlation (R2 = 1), the red line showed the measured correlation (five components for NEFA, four components for leptin, three components for LBP). (D,F) Color legend: red = smc (significance multivariate correlation); dark green = vip (variable importance in projections); light green = sr (selectivity ratio); dark blue = lw (loading weight); light blue = rc (regression coefficient). Abbreviations: see Table 1.
Figure 4
Figure 4
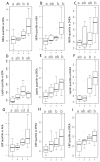
Univariate tests on quartiles. The number 1 corresponds to the lower quartile, while the number 4 corresponds to the upper quartile. (A,B) Boxplots of the concentration of (A) OEA, (B) AEA, (C) DHEA, according to NEFA quartiles. (DF) Boxplots of the concentration of (D) EPA, (E) EPEA, (F) DHEA, according to leptin quartiles. (GI) Boxplots of the concentration of (G) AEA, (H) EPEA, (I) DPEA, according to LBP quartiles. Data with different superscript letters are significantly different at p < 0.05, according to the post-hoc ANOVA statistical analysis (C,F), or Kruskal-Wallis multiple comparisons test (A,B,D,E,GI). Abbreviations: see Table 1.

References

    1. Di Marzo V. The endocannabinoidome as a substrate for noneuphoric phytocannabinoid action and gut microbiome dysfunction in neuropsychiatric disorders. Dialogues Clin. Neurosci. 2020;22:259–269. doi: 10.31887/DCNS.2020.22.3/vdimarzo. - DOI - PMC - PubMed
    1. Cani P.D., Plovier H., Van Hul M., Geurts L., Delzenne N.M., Druart C., Everard A. Endocannabinoids--at the crossroads between the gut microbiota and host metabolism. Nat. Rev. Endocrinol. 2016;12:133–143. doi: 10.1038/nrendo.2015.211. - DOI - PubMed
    1. Veilleux A., Di Marzo V., Silvestri C. The Expanded Endocannabinoid System/Endocannabinoidome as a Potential Target for Treating Diabetes Mellitus. Curr. Diabetes Rep. 2019;19:117. doi: 10.1007/s11892-019-1248-9. - DOI - PubMed
    1. Cristino L., Bisogno T., Di Marzo V. Cannabinoids and the expanded endocannabinoid system in neurological disorders. Nat. Rev. Neurol. 2020;16:9–29. doi: 10.1038/s41582-019-0284-z. - DOI - PubMed
    1. Di Marzo V. New approaches and challenges to targeting the endocannabinoid system. Nat. Rev. Drug Discov. 2018;17:623–639. doi: 10.1038/nrd.2018.115. - DOI - PubMed

Publication types

Associated data