. 2021 Jan 5;26(1):234.
doi: 10.3390/molecules26010234.

Evaluation of Changes in Protein Quality of High-Pressure Treated Aqueous Aquafaba

Affiliations

Evaluation of Changes in Protein Quality of High-Pressure Treated Aqueous Aquafaba

Fatemah B Alsalman et al. Molecules. .

Abstract

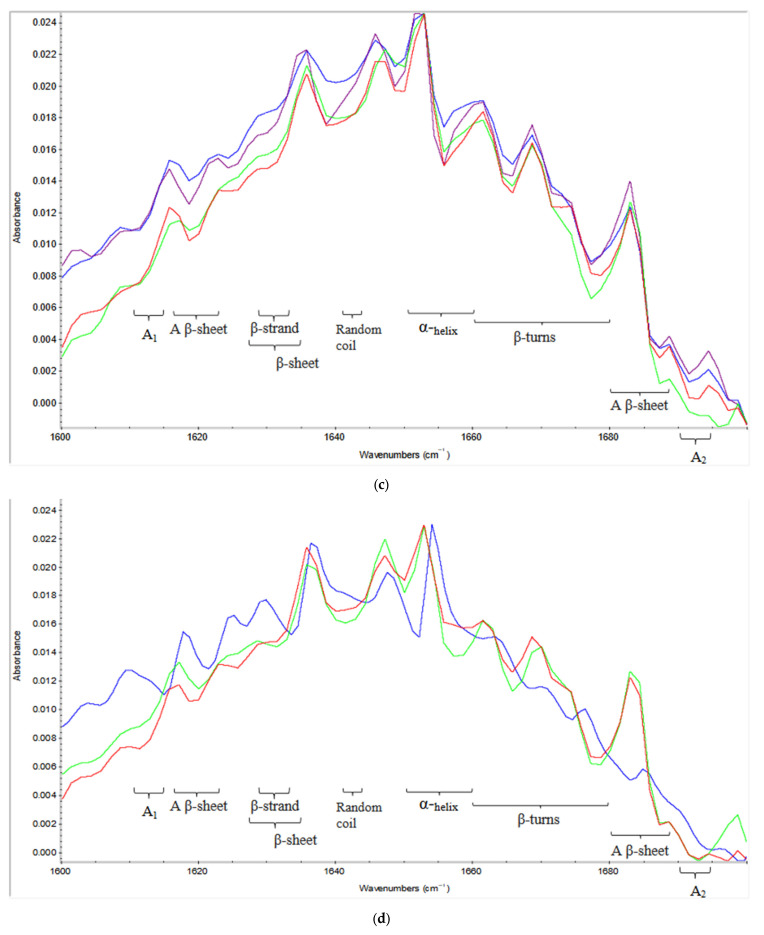
Chickpea cooking water (CCW), known as aquafaba, has potential as a replacement for egg whites due to its emulsion and foaming properties which come from the proteins and starch that leach out from chickpeas into the cooking water. High pressure (HP) processing has the ability to modify the functional characteristics of proteins. It is hypothesized that HP processing could favorably affect the functional properties of CCW proteins by influencing their structure. The objective of this study to evaluate the effect of HP treatment on the associated secondary structure, emulsion properties and thermal characteristics of CCW proteins. A central composite rotatable design is used with pressure level (227-573 MPa) and treatment time (6-24 min) as HP variables, and concentration of freeze dried CCW aquafaba powder (11-29%) as product variable, and compared to untreated CCW powder. HP improves aquafaba emulsion properties compared to control sample. HP reduces protein aggregates by 33.3%, while β-sheets decreases by 4.2-87.6% in which both correlated to increasing protein digestibility. α-helices drops by 50%. It affects the intensity of some HP treated samples, but not the trend of bands in most of them. HP treatment decreases Td and enthalpy because of increasing the degree of denaturation.

Keywords: aquafaba; emulsification properties; high pressure processing; protein quantification by ftir; thermal properties.


Conflict of interest statement

Authors confirm that there is no conflict of interest in the work.

Figures

Figure 1
Figure 1
3-D graphs corresponding to models fitted for emulsion capacity (a), emulsion stability (b), temperature of denaturation (c), and enthalpy (d).
Figure 1
Figure 1
3-D graphs corresponding to models fitted for emulsion capacity (a), emulsion stability (b), temperature of denaturation (c), and enthalpy (d).
Figure 2
Figure 2
3-D graphs corresponding to models fitted for protein aggregates (a), beta-sheets (b), random coil (c), alpha-helices (d), beta-turns (e), antiparallel beta-sheets (f), and beta-sheets aggregates (g) of chickpea water (aquafaba) teated with HP.
Figure 2
Figure 2
3-D graphs corresponding to models fitted for protein aggregates (a), beta-sheets (b), random coil (c), alpha-helices (d), beta-turns (e), antiparallel beta-sheets (f), and beta-sheets aggregates (g) of chickpea water (aquafaba) teated with HP.
Figure 3
Figure 3
(a). FT-IR spectra of HP treated aquafaba samples and control sample. Blue line (Run 1) = 300 MPa for 10 min with 15% aquafaba concentration; Purple line (Run 2) = 300 MPa for 20 min with 25% aquafaba concentration; Green line (Run 3) = 300 MPa for 10 min with 25% aquafaba concentration; Red line (Run 4) = 300 MPa for 20 min with 15% aquafaba concentration; (b). FT-IR spectra of HP treated aquafaba samples and control sample. Blue line (Run 19) = 400 MPa for 15 min with 20% aquafaba concentration; Purple line (Run 20) = 400 MPa for 24 min with 20% aquafaba concentration; Green line (Run 21) = 400 MPa for 15 min with 29% aquafaba concentration; Turkuaz line (Run 22) = 400 MPa for 6 min with 20% aquafaba concentration; Red line (Run 23) = 400 MPa for 15 min with 11% aquafaba concentration; (c). FT-IR spectra of HP treated aquafaba samples. Blue line (Run 8) = 500 MPa for 20 min with 15% aquafaba concentration; Purple line (Run 9) = 500 MPa for 20 min with 25% aquafaba concentration; Green line (Run 10) = 500 MPa for 10 min with 25% aquafaba concentration; Red line (Run 11) = 500 MPa for 10 min with 15% aquafaba concentration; (d). FT-IR spectra of HP treated aquafaba samples and control sample. Blue line = aquafaba without HP treatment (control), red line = HP treated sample at 227 MPa for 15 min with 20% aquafaba concentration, and green line = HP treated sample at 573 MPa for 15 min with 20% aquafaba concentration.
Figure 3
Figure 3
(a). FT-IR spectra of HP treated aquafaba samples and control sample. Blue line (Run 1) = 300 MPa for 10 min with 15% aquafaba concentration; Purple line (Run 2) = 300 MPa for 20 min with 25% aquafaba concentration; Green line (Run 3) = 300 MPa for 10 min with 25% aquafaba concentration; Red line (Run 4) = 300 MPa for 20 min with 15% aquafaba concentration; (b). FT-IR spectra of HP treated aquafaba samples and control sample. Blue line (Run 19) = 400 MPa for 15 min with 20% aquafaba concentration; Purple line (Run 20) = 400 MPa for 24 min with 20% aquafaba concentration; Green line (Run 21) = 400 MPa for 15 min with 29% aquafaba concentration; Turkuaz line (Run 22) = 400 MPa for 6 min with 20% aquafaba concentration; Red line (Run 23) = 400 MPa for 15 min with 11% aquafaba concentration; (c). FT-IR spectra of HP treated aquafaba samples. Blue line (Run 8) = 500 MPa for 20 min with 15% aquafaba concentration; Purple line (Run 9) = 500 MPa for 20 min with 25% aquafaba concentration; Green line (Run 10) = 500 MPa for 10 min with 25% aquafaba concentration; Red line (Run 11) = 500 MPa for 10 min with 15% aquafaba concentration; (d). FT-IR spectra of HP treated aquafaba samples and control sample. Blue line = aquafaba without HP treatment (control), red line = HP treated sample at 227 MPa for 15 min with 20% aquafaba concentration, and green line = HP treated sample at 573 MPa for 15 min with 20% aquafaba concentration.
Figure 4
Figure 4
(a). SDS-PAGE of HP treated aquafaba proteins. STD = standard proteins; column: C = control (untreated aquafaba); Run 12 = 227 MPa for 15 min with 20% concentration; Run 1 = 300 MPa for 10 min with 15% concentration; Run 4 = 300 MPa for 20 min with 15% concentration; Run 3 = 300 MPa for 10 min with 25% concentration; Run 2 = 300 MPa for 20 min with 25% concentration; Run 23 = 400 MPa for 15 min with 11% concentration; Run 22 = 400 MPa for 6 min with 20% concentration; (b). SDS-PAGE of HP treated aquafaba proteins. STD = standard proteins; column: C = control (untreated aquafaba); Run 11 = 500 MPa for 10 min with 15% concentration; Run 8 = 500 MPa for 20 min with 15% concentration; Run 10 = 500 MPa for 10 min with 25% concentration; Run 9 = 500 MPa for 20 min with 25% concentration; Run 24 = 573 MPa for 15 min with 20% concentration; Run 19 = 400 MPa for 15 min with 20% concentration; Run 20 = 400 MPa for 24 min with 20% concentration; Run 21 = 400 MPa for 15 min with 29% concentration.
Figure 4
Figure 4
(a). SDS-PAGE of HP treated aquafaba proteins. STD = standard proteins; column: C = control (untreated aquafaba); Run 12 = 227 MPa for 15 min with 20% concentration; Run 1 = 300 MPa for 10 min with 15% concentration; Run 4 = 300 MPa for 20 min with 15% concentration; Run 3 = 300 MPa for 10 min with 25% concentration; Run 2 = 300 MPa for 20 min with 25% concentration; Run 23 = 400 MPa for 15 min with 11% concentration; Run 22 = 400 MPa for 6 min with 20% concentration; (b). SDS-PAGE of HP treated aquafaba proteins. STD = standard proteins; column: C = control (untreated aquafaba); Run 11 = 500 MPa for 10 min with 15% concentration; Run 8 = 500 MPa for 20 min with 15% concentration; Run 10 = 500 MPa for 10 min with 25% concentration; Run 9 = 500 MPa for 20 min with 25% concentration; Run 24 = 573 MPa for 15 min with 20% concentration; Run 19 = 400 MPa for 15 min with 20% concentration; Run 20 = 400 MPa for 24 min with 20% concentration; Run 21 = 400 MPa for 15 min with 29% concentration.

References

    1. de Almeida Costa G.E., Silva Queiroz-Monici K., Reis S.M.P.M., de Oliveira A.C. Chemical Composition, Dietary Fibre and Resistant Starch Contents of Raw and Cooked Pea, Common Bean, Chickpea and Lentil Legumes. Food Chem. 2006;94:327–330. doi: 10.1016/j.foodchem.2004.11.020. - DOI
    1. Shevkani K., Singh N., Chen Y., Kaur A., Yu L. Pulse Proteins: Secondary Structure, Functionality and Applications. J. Food Sci. Technol. 2019;56:2787–2798. doi: 10.1007/s13197-019-03723-8. - DOI - PMC - PubMed
    1. Xu Y., Obielodan M., Sismour E., Arnett A., Alzahrani S., Zhang B. Physicochemical, Functional, Thermal and Structural Properties of Isolated Kabuli Chickpea Proteins as Affected by Processing Approaches. Int. J. Food Sci. Technol. 2017;52:1147–1154. doi: 10.1111/ijfs.13400. - DOI
    1. Aguilera Y., Esteban R.M., Benítez V., Molla E., Martín-Cabrejas M.A. Starch, Functional Properties, and Microstructural Characteristics in Chickpea and Lentil as Affected by Thermal Processing. J. Agric. Food Chem. 2009;57:10682–10688. doi: 10.1021/jf902042r. - DOI - PubMed
    1. Chávez-Murillo C.E., Veyna-Torres J.I., Cavazos-Tamez L.M., de la Rosa-Millán J., Serna-Saldívar S.O. Physicochemical Characteristics, ATR-FTIR Molecular Interactions and in Vitro Starch and Protein Digestion of Thermally-Treated Whole Pulse Flours. Food Res. Int. 2018;105:371–383. doi: 10.1016/j.foodres.2017.11.029. - DOI - PubMed

Publication types

LinkOut - more resources