. 2021 Jan 5;22(1):462.
doi: 10.3390/ijms22010462.

The Thyroid Hormone Transporter Mct8 Restricts Cathepsin-Mediated Thyroglobulin Processing in Male Mice through Thyroid Auto-Regulatory Mechanisms That Encompass Autophagy

Affiliations

The Thyroid Hormone Transporter Mct8 Restricts Cathepsin-Mediated Thyroglobulin Processing in Male Mice through Thyroid Auto-Regulatory Mechanisms That Encompass Autophagy

Vaishnavi Venugopalan et al. Int J Mol Sci. .

Abstract

The thyroid gland is both a thyroid hormone (TH) generating as well as a TH responsive organ. It is hence crucial that cathepsin-mediated proteolytic cleavage of the precursor thyroglobulin is regulated and integrated with the subsequent export of TH into the blood circulation, which is enabled by TH transporters such as monocarboxylate transporters Mct8 and Mct10. Previously, we showed that cathepsin K-deficient mice exhibit the phenomenon of functional compensation through cathepsin L upregulation, which is independent of the canonical hypothalamus-pituitary-thyroid axis, thus, due to auto-regulation. Since these animals also feature enhanced Mct8 expression, we aimed to understand if TH transporters are part of the thyroid auto-regulatory mechanisms. Therefore, we analyzed phenotypic differences in thyroid function arising from combined cathepsin K and TH transporter deficiencies, i.e., in Ctsk-/-/Mct10-/-, Ctsk-/-/Mct8-/y, and Ctsk-/-/Mct8-/y/Mct10-/-. Despite the impaired TH export, thyroglobulin degradation was enhanced in the mice lacking Mct8, particularly in the triple-deficient genotype, due to increased cathepsin amounts and enhanced cysteine peptidase activities, leading to ongoing thyroglobulin proteolysis for TH liberation, eventually causing self-thyrotoxic thyroid states. The increased cathepsin amounts were a consequence of autophagy-mediated lysosomal biogenesis that is possibly triggered due to the stress accompanying intrathyroidal TH accumulation, in particular in the Ctsk-/-/Mct8-/y/Mct10-/- animals. Collectively, our data points to the notion that the absence of cathepsin K and Mct8 leads to excessive thyroglobulin degradation and TH liberation in a non-classical pathway of thyroid auto-regulation.

Keywords: autophagy; cathepsins; lysosomal biogenesis; monocarboxylate transporter 8; thyroid auto-regulation.


Conflict of interest statement

The authors declare no conflict of interest. The funders had no role in the design of the study; in the collection, analyses, or interpretation of data; in the writing of the manuscript, or in the decision to publish the results.

Figures

Figure 1
Figure 1
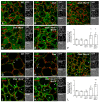
Thyroglobulin storage status in combined cathepsin K and TH transporter deficiency. Thyroid cryo-sections were immunolabelled with antibodies against Tg (green), and the intraluminal Tg status was assessed in (A) WT, (B) Ctsk-/-, (C) Ctsk-/-/Mct10-/-, (D) Ctsk-/-/Mct8-/y, and (E) Ctsk-/-/Mct8-/y/Mct10-/- mice by confocal laser scanning microscopy. Single-channel fluorescence and corresponding phase contrast micrographs are depicted in the right panels as indicated. Tg staining in the lumen was either homogenous and rather faint, corresponding to tightly compacted Tg (asterisks), or appeared multilayered, referring to solubilized Tg (arrows), depending on the accessibility of intraluminal Tg for binding of the Tg-specific antibodies. Bar graphs indicate the proportion of follicles displaying compacted (F) and solubilized Tg (G) relative to the total number of investigated follicles, respectively, in the genotypes. Mice lacking both, cathepsin K and TH transporters, showed a decrease in the number of follicles with compacted Tg, and accordingly an increase in the number of follicles exhibiting Tg in multilayers. Animals analyzed: n = 3 per genotype, numbers of follicles analyzed: n = 1151, 688, 633, 743, and 852 for WT, Ctsk-/-, Ctsk-/-/Mct10-/-, Ctsk-/-/Mct8-/y, and Ctsk-/-/Mct8-/y/Mct10-/- mice, respectively. Nuclei were counter-stained with Draq5TM (red). Scale bars represent 50 µm. Data is depicted as means ± SD. Levels of significance are indicated as * for p < 0.05 and *** for p < 0.001.
Figure 2
Figure 2
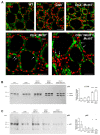
Thyroglobulin cross-linkage in combined cathepsin K and TH transporter deficiencies. Proteins isolated from whole thyroid tissue lysates of the indicated genotypes and WT controls were separated on 8–18% horizontal SDS-gels under non-reducing conditions, transferred onto nitrocellulose membrane, and immunoblotted using Tg-specific antibodies. A representative immunoblot is shown (A). The molecular mass markers are given in the left margin. Bands representing multimers, dimers, monomers, and fragments of Tg are indicated in the right margin. Bar charts (BE) represent densitometry analyses of total Tg (B), Tg multimers (C), Tg dimers (D), Tg monomers/Tg dimers (E), and Tg fragments/Tg dimers (F) in the investigated genotypes as fold changes over WT controls. No genotypic differences in band intensities of Tg multimers or Tg dimers were observed, indicating that Tg cross-linkage most likely remained unaltered upon cathepsin K and/or TH transporter deficiencies. The ratio of band intensities of Tg monomers over Tg dimers (representing Tg solubilization), as well as Tg fragments over Tg dimers (representing Tg degradation) showed an increase in Ctsk-/-/Mct8-/y and Ctsk-/-/Mct8-/y/Mct10-/- thyroid tissue, suggesting enhanced solubilization and altered proteolytic processing of Tg. Animals analyzed: n = 3–4 per genotype. Densitometry data was normalized to total Ponceau-stained protein per lane and is depicted as means ± SD. Levels of significance are indicated as ** for p < 0.01 and *** for p < 0.001.
Figure 3
Figure 3
Protein glycosylation in combined cathepsin K and TH transporter deficiencies. Thyroid tissue sections from (A) WT, (B) Ctsk-/-, (C) Ctsk-/-/Mct10-/-, (D) Ctsk-/-/Mct8-/y, and (E) Ctsk-/-/Mct8-/y/Mct10-/- mice were stained with biotinylated lectin ConA and Alexa 546-conjugated streptavidin (green) to assess any difference in glycosylation states by confocal laser scanning microscopy. Merged, single-channel fluorescence, and corresponding phase contrast micrographs are displayed as indicated. The intensity of ConA staining was measured using a Cell Profiler pipeline and normalized to the numbers of cells (F). Mice lacking both cathepsin K and either or both TH transporters showed a significant decrease in the ConA signal. Animals analyzed: n = 3 per genotype with 8–10 micrographs quantified per animal, respectively. Nuclei were counter-stained with Draq5TM (red). Scale bars represent 50 µm. Data is depicted as fold changes over WT controls as means ± SD. Levels of significance are indicated as * for p < 0.05 and *** for p < 0.001.
Figure 4
Figure 4
Gross thyroglobulin degradation states in thyroid glands of mice lacking cathepsin K and TH transporters. Whole thyroid tissue lysates of indicated genotypes and WT controls were separated on 8–18% horizontal SDS-gels under reducing conditions, transferred onto nitrocellulose membrane, and subsequently probed with anti-Tg antibodies. Shown is a representative immunoblot (A). The molecular mass markers are given in the left margin. Bands representing dimers, monomers, and fragments of Tg are indicated in the right margin of the immunoblot. Bar charts (BE) represent densitometry analyses of total Tg (B), Tg dimers (C), Tg monomers (D), and Tg fragments (E) in the investigated genotypes as fold changes over WT controls. Ctsk-/-/Mct8-/y and Ctsk-/-/Mct8-/y/Mct10-/- mice showed a decrease in mono- and dimeric Tg amounts, while exhibiting an increase in the amounts of Tg fragments, thereby indicating enhanced Tg degradation. Animals analyzed: n = 3–4 per genotype. Densitometry data was normalized to total Ponceau-stained protein per lane and is depicted as means ± SD. Levels of significance are indicated as * for p < 0.05, ** for p < 0.01, and *** for p < 0.001.
Figure 5
Figure 5
Active cysteine peptidases in thyroid glands of mice lacking cathepsin K alone or in combination with TH transporter deficiencies. Whole thyroid tissue from WT, Ctsk-/-, Ctsk-/-/Mct10-/-, Ctsk-/-/Mct8-/y and Ctsk-/-/Mct8-/y/Mct10-/- mice was homogenized in lysis buffer containing 5 µM biotinylated activity-based probe DCG-04 before protein separation and staining of the blots with HRP-conjugated streptavidin to exclusively detect proteolytically active cysteine peptidases (A). Molecular mass markers are indicated in the left margin. Controls were conducted with WT tissue that was lysed without the addition of DCG-04, demonstrating streptavidin detection of some high molecular mass bands representing endogenous biotinylated proteins (B). However, these are most likely not cysteine peptidases ranging from 20–30 kDa in molecular mass. Therefore, the densities of the resulting bands below the 32-kDa molecular mass marker were normalized to total Ponceau-stained protein per lane, and are presented as fold changes over WT (C). It is important to note that the DCG-04 activity-based probe binds in equimolar ratio to active cysteine peptidases, only. The quantitation of signal intensities is therefore representative of proteolytic activity. The relative signal intensity of active cysteine peptidases was higher in thyroid lysates of Ctsk-/-/Mct8-/y and further enhanced in Ctsk-/-/Mct8-/y/Mct10-/- mice in comparison to WT controls (C). Animals analyzed: n = 3–4 per genotype. Data is depicted as means ± SD. Levels of significance are indicated as * for p < 0.05 and *** for p < 0.001.
Figure 6
Figure 6
Cystatin C and D levels in combined cathepsin K and TH transporter deficiencies. Thyroid cryo-sections from mice of the indicated genotypes and WT controls were stained with antibodies specific for cystatin C (AE) or cystatin D (GK) (green). Merged, single-channel fluorescence, and corresponding phase contrast micrographs are displayed as indicated. Micrographs show that cystatin C predominantly localized to the thyroid follicle lumen (AE, asterisks) while cystatin D mainly localized to the apical pericellular space of thyrocytes (GK, arrows) in all genotypes investigated. Intraluminal cystatin C (D and E, asterisks) and D (J and K, asterisks) signals appeared enhanced in mice lacking Mct8. The intensities of cystatin C and D staining were measured using a Cell Profiler pipeline and normalized to the numbers of cells (F and L, respectively). Ctsk-/-/Mct8-/y/Mct10-/- mice showed a two-fold increase in thyroidal cystatin C and D signals when compared to WT controls. Animals analyzed: n = 3 per genotype with 7–12 micrographs quantified per animal, respectively. Nuclei were counter-stained with Draq5TM (red). Scale bars represent 50 µm. Data is depicted as fold changes over WT controls as means ± SD. Levels of significance are indicated as * for p < 0.05 and ** for p < 0.01.
Figure 7
Figure 7
Maturation states of cathepsin B, D, and L remain unaltered in combined cathepsin K and TH transporter deficiency. Whole thyroid tissue lysates from WT, Ctsk-/-, Ctsk-/-/Mct10-/-, Ctsk-/-/Mct8-/y, and Ctsk-/-/Mct8-/y/Mct10-/- mice were immunoblotted using antibodies specific for cathepsins B, D, or L, as indicated (AC, respectively, left panels). Molecular mass markers are displayed in the left margins. Bands representing proform (pro), single-chain (SC), and heavy-chain (HC) of two-chain forms are indicated in the right margin of the immunoblots. The density of the resulting bands was normalized to total Ponceau-stained protein per lane. Bar graphs represent amounts of total cathepsins (AC, right panels) and corresponding processed forms (AC, bottom panels), respectively, as fold changes over WT. The total amounts of all investigated cathepsins were predominantly increased in Ctsk-/-/Mct8-/y/Mct10-/- mice when compared to WT controls. The maturation states of cathepsins B and L did not differ in any genotype. Animals analyzed: n = 3–4 per genotype. Data is depicted as means ± SD. Levels of significance are indicated as * for p < 0.05, ** for p < 0.01, and *** for p < 0.001.
Figure 8
Figure 8
Assessing the induction of lysosomal biogenesis in mice lacking cathepsin K and TH transporters. Thyroid tissue sections from (A) WT, (B) Ctsk-/-, (C) Ctsk-/-/Mct10-/-, (D) Ctsk-/-/Mct8-/y, and (E) Ctsk-/-/Mct8-/y/Mct10-/- mice were stained with antibodies against Lamp1 (green) and imaged by confocal laser scanning microscopy (AE). As expected, Lamp1 signals were observed on vesicular membranes in all investigated genotypes. The intensity of Lamp1 staining (F) and the numbers of vesicles containing Lamp1 or cathepsins B, D or L (GJ, respectively) were determined using a Cell Profiler pipeline and normalized to the numbers of cells. Note that Lamp1 signals and the numbers of vesicles per cell were significantly increased in thyroid tissue of the triple-deficient genotype. Animals analyzed: n = 3 per genotype with 8–10 micrographs quantified per animal, respectively. Nuclei were counter-stained with Draq5TM (red). Scale bars represent 20 µm. Data is depicted as fold changes over WT controls as means ± SD. Levels of significance are indicated as * for p < 0.05, ** for p < 0.01, and *** for p < 0.001.
Figure 9
Figure 9
Proteome analysis of lysosomal constituents in thyroid tissue of Ctsk-/-/Mct8-/y/Mct10-/- mice. Snap-frozen thyroid tissue from the triple-deficient murine model and WT controls were analyzed using LC-MS/MS. The bars depict fold changes of derived protein levels (means) of commonly known targets of lysosomal biogenesis and those that play a role in lysosomal function in comparison to WT controls (WT = 1, left panel). The q-values derived by Welch’s t-test indicated that the protein levels of 33 out of 39 lysosomal proteins were significantly increased in Ctsk-/-/Mct8-/y/Mct10-/- vs. WT thyroid tissue (center panel). Bars and q-values for corresponding proteins that show significant differences are indicated in bold. Volcano plot of proteome data displaying the pattern of differential thyroid protein abundance for Ctsk-/-/Mct8-/y/Mct10-/- mice relative to WT animals is shown (right panel). The x-axis indicates the log2 of the protein ratios in the comparison and the y-axis indicates the negative decadic logarithm of the p-values. Significantly differentially abundant proteins (p ≤ 0.05, fold change ≥ |1.5|) are highlighted as red or blue points, indicating proteins present in increased and decreased amounts in Ctsk-/-/Mct8-/y/Mct10-/- mice relative to WT animals, respectively. Lysosomal proteins are explicitly labelled.
Figure 10
Figure 10
Autophagy in the thyroid glands of mice lacking cathepsin K and TH transporters. Mouse thyroid glands from the indicated genotypes were sectioned and stained with LC3-specific antibodies (A, green). Immunofluorescence analyses revealed diffuse staining patterns for LC3 in WT, Ctsk-/-, and Ctsk-/-/Mct10-/-, while LC3 signals were punctate and rather vesicular (arrows) in Ctsk-/-/Mct8-/y and Ctsk-/-/Mct8-/y/Mct10-/- thyroids (A). Nuclei were counter-stained with Draq5TM (A, red). Scale bars represent 50 µm. Thyroid tissue lysates were separated on horizontal SDS-gels and immunoblotted for LC3 (B, left panel) or p62 (C, left panel). LC3-II and p62 band intensities were determined by densitometry and normalized to total Ponceau-stained protein per lane (B and C, right panels, respectively). Densitometry analyses confirmed that autophagy was induced in Ctsk-/-/Mct8-/y and Ctsk-/-/Mct8-/y/Mct10-/- mice. In both genotypes, the LC3-II signal was enhanced while the p62 signal was diminished in comparison to WT controls, corresponding to increased autophagosomal numbers and autophagic flux, respectively. Animals analyzed: n = 5–6 per genotype with 8–10 micrographs quantified per animal in A, respectively, and n = 3–4 per genotype in (B) and (C). Densitometry data is depicted as fold changes over WT as means ± SD. Levels of significance are indicated as * for p < 0.05, ** for p < 0.01, and *** for p < 0.001.
Figure 11
Figure 11
Intrathyroidal iodine levels in combined cathepsin K and TH transporter deficiency. Whole thyroid tissue lysates from WT, Ctsk-/-, Ctsk-/-/Mct10-/-, Ctsk-/-/Mct8-/y, and Ctsk-/-/Mct8-/y/Mct10-/- mice were normalized to 1 µg of total protein and the SK reaction was performed to determine intrathyroidal iodine concentrations. Displayed is a bar graph representing iodine concentrations in all genotypes as fold changes over WT controls (A). Intrathyroidal iodine concentrations were significantly enhanced in Ctsk-/-/Mct8-/y, and more prominently in Ctsk-/-/Mct8-/y/Mct10-/- mice. Snap-frozen thyroid tissue from Ctsk-/-/Mct8-/y/Mct10-/- mice was further subjected to Omics analyses to study differential expression of genes and respective levels of proteins involved in iodine supply through the blood circulation (CD31) or by iodide uptake (NIS) (B), neither of which showed significant differences when compared to WT controls, while NIS mRNA and protein showed a trend toward increased levels. (C) Thyroid tissue lysates were separated on horizontal SDS-gels and immunoblotted for NIS (C), and the band intensities were determined by densitometry and normalized to total Ponceau-stained protein per lane (D). Molecular mass markers are displayed in the left margins (C). Bands representing NIS are indicated in the right margin of the immunoblots (C). Immunoblot and densitometry analyses confirmed that NIS amounts were not altered in Ctsk-/-/Mct8-/y/Mct10-/- mice in comparison to WT controls (C and D). Densitometry data is depicted as fold changes over WT (D). Animals analyzed: n = 3–5 per genotype. Data is depicted as means ± SD. Levels of significance are indicated as ** for p < 0.01 and *** for p < 0.001.
Figure 12
Figure 12
Nuclear T3 amounts in thyroids lacking cathepsin K and TH transporters. Cryo-sections of thyroid glands from WT, Ctsk-/-, Ctsk-/-/Mct10-/-, Ctsk-/-/Mct8-/y, and Ctsk-/-/Mct8-/y/Mct10-/- mice were incubated with T3-specific antibodies (green) and analyzed by confocal laser scanning microscopy (A′–E′, respectively). T3 signals in the nuclei of thyrocytes (yellow) for all investigated genotypes are depicted upon desaturation of the T3-channel (AE, respectively). Areas occupied by nuclear T3 over the total nuclear area was determined by a Cell Profiler-based pipeline representing an observer-unbiased approach, and the proportion of nuclear T3 signals are displayed as fold changes over WT controls (F). Ctsk-/-/Mct8-/y and Ctsk-/-/Mct8-/y/Mct10-/- mice show enhanced accumulation of T3 within the nuclei of thyroid epithelial cells, indicating thyrotoxicity. Note that a decrease in nuclear T3 was observed in Ctsk-/- thyroids which feature enhanced Mct8-mediated TH export. Nuclei were counter-stained with Draq5TM (red). The Mct8-deficient genotypes showed dead cells in follicle lumina with nuclear T3 (D and E, arrowheads). Scale bars represent 50 µm. Animals analyzed: n = 3 per genotype with 6–10 micrographs quantified per animal in A-E, respectively. Data is depicted as means ± SD. Levels of significance are indicated as * for p < 0.05, ** for p < 0.01, and *** for p < 0.001.
Figure 13
Figure 13
Automated image analysis using a Cell Profiler pipeline. Schematic diagram outlining the modules used for quantifying cathepsin amounts and numbers of cathepsin-positive vesicles within thyrocytes. As an example, a thyroid tissue section stained with cathepsin B antibody is shown. The input image contains three channels, namely, cathepsin (green), CMO stain for cell cytoplasm (red), and Draq5TM counter-stain for nuclei (blue). (1) The input image was split into individual channels and converted to gray scale output images OrigRed, OrigGreen, and OrigBlue, respectively. (2) The OrigRed image representative of the CMO cytoplasmic staining was converted to a binary image after applying a threshold to eliminate any unspecific signal in the lumen. (3) The OrigBlue image was used to identify the nuclei. (4) To obtain total cathepsin intensity, the signal from the OrigGreen image was measured. (5) OrigRed was used to mask OrigGreen to exclusively detect immuno-positive signals in the epithelium (‘IntraCellular_Cath’). (6) IntraCellular_Cath was used to identify vesicles which were counted. Nuclear counts (step 3) were used to normalize as indicated in illustrations of the respective analyses.

Similar articles

Cited by

References

    1. Fujita H. Functional Morphology of the Thyroid. In: Jeon K.W., Friedlander M., editors. International Review of Cytology. Volume 113. Academic Press; Cambridge, MA, USA: 1988. pp. 145–185. - PubMed
    1. Nilsson M., Fagman H. Mechanisms of thyroid development and dysgenesis: An analysis based on developmental stages and concurrent embryonic anatomy. Curr. Top. Dev. Biol. 2013;106:123–170. doi: 10.1016/b978-0-12-416021-7.00004-3. - DOI - PubMed
    1. Brix K., Qatato M., Szumska J., Venugopalan V., Rehders M. Thyroglobulin Storage, Processing and Degradation for Thyroid Hormone Liberation. In: Luster M., Duntas L.H., Wartofsky L., editors. The Thyroid and Its Diseases. Springer; Berlin/Heidelberg, Germany: 2019. pp. 25–48. - DOI
    1. Colin I.M., Denef J.F., Lengelé B., Many M.C., Gérard A.C. Recent insights into the cell biology of thyroid angiofollicular units. Endocr. Rev. 2013;34:209–238. doi: 10.1210/er.2012-1015. - DOI - PMC - PubMed
    1. Fliers E., Kalsbeek A., Boelen A. Beyond the fixed setpoint of the hypothalamus-pituitary-thyroid axis. Eur. J. Endocrinol. 2014;171:R197–R208. doi: 10.1530/EJE-14-0285. - DOI - PubMed

LinkOut - more resources