. 2021 Jan 14;13(2):289.
doi: 10.3390/cancers13020289.

Synergism of Proneurogenic miRNAs Provides a More Effective Strategy to Target Glioma Stem Cells

Affiliations

Synergism of Proneurogenic miRNAs Provides a More Effective Strategy to Target Glioma Stem Cells

Adam Kosti et al. Cancers (Basel). .

Abstract

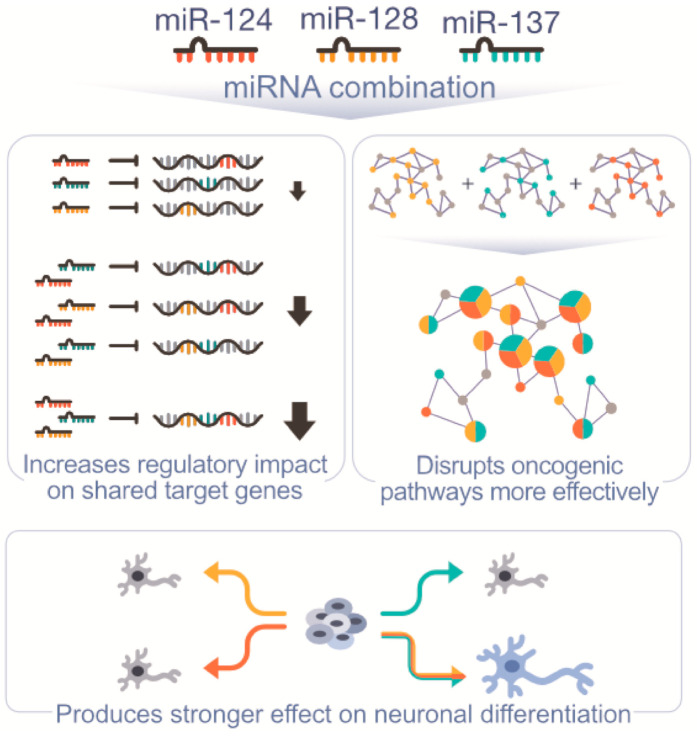
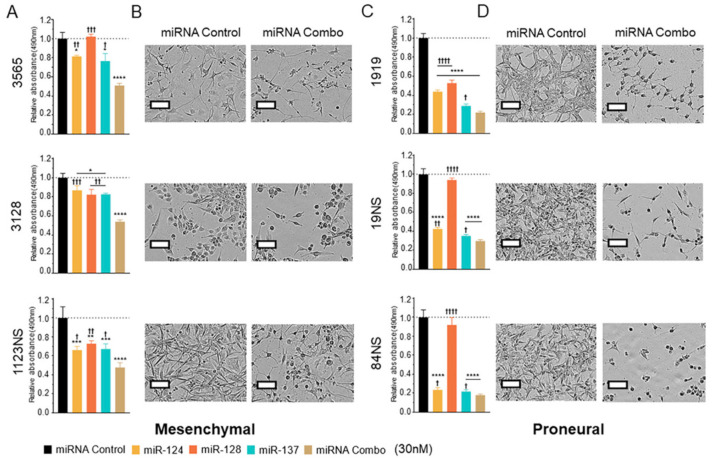
Tumor suppressor microRNAs (miRNAs) have been explored as agents to target cancer stem cells. Most strategies use a single miRNA mimic and present many disadvantages, such as the amount of reagent required and the diluted effect on target genes. miRNAs work in a cooperative fashion to regulate distinct biological processes and pathways. Therefore, we propose that miRNA combinations could provide more efficient ways to target cancer stem cells. We have previously shown that miR-124, miR-128, and miR-137 function synergistically to regulate neurogenesis. We used a combination of these three miRNAs to treat glioma stem cells and showed that this treatment was much more effective than single miRNAs in disrupting cell proliferation and survival and promoting differentiation and response to radiation. Transcriptomic analyses indicated that transcription regulation, angiogenesis, metabolism, and neuronal differentiation are among the main biological processes affected by transfection of this miRNA combination. In conclusion, we demonstrated the value of using combinations of neurogenic miRNAs to disrupt cancer phenotypes and glioma stem cell growth. The synergistic effect of these three miRNA amplified the repression of oncogenic factors and the effect on cancer relevant pathways. Future therapeutic approaches would benefit from utilizing miRNA combinations, especially when targeting cancer-initiating cell populations.

Keywords: glioblastoma; miR-124; miR-128; miR-137; miRNA; neuroblastoma.


Conflict of interest statement

The authors declare no conflict of interest.

Figures

Figure 1
Figure 1
miR-124, miR-128, and miR-137 synergism. Model for synergistic interactions between miR-124, miR-128, and miR-137. Combined action of the three miRNAs on shared and associated targets produces a stronger regulatory effect. This includes a stronger repression of shared targets, increased effect on neuronal differentiation, and broader and stronger impact on oncogenic pathways.
Figure 2
Figure 2
miR-124, miR-128, and miR137 coexpression in glioma and neuroblastoma patients and impact on patient survival. (A) miRNA expression correlation in patient samples from the The Cancer Genome Atlas Low Grade Glioma (TCGA LGG), The Cancer Genome Atlas Glioblastoma Multiforme (TCGA GBM), and in neuroblastoma (Schulte study). Upper right panels display Pearson correlation coefficient between the miRNAs. Middle panels display distribution of miRNA expression. Lower left panels display miRNA expression scatterplots. (B) Survival rates of patients expressing low vs. high miR-124, -128, and -137 in TCGA LGG, D’Urso GBM Study, and Schulte Neuroblastoma Study.
Figure 3
Figure 3
Synergistic effects of miR-124, miR-128, and miR-137 on glioblastoma cells. (A,E) Cell proliferation with live-cell imaging (Incucyte) of U251 and U343 cells following reverse transfection with low concentrations (10 nM) of individual miRNAs and combination of the three miRNAs (total 30 nM). Effects of the combination were greater than expected additivity, indicating synergy based on linear and Bliss models (U251 Linear CI: 0.339; Bliss CI: 0.338; U343 Linear CI: 0.152; Bliss CI: 0.151). Tukey test for significance at 120 h, # = p < 0.0001. (B,F) Effects of miRNA combination on cell proliferation versus individual miRNAs at an equivalent concentration (30 nM). Tukey test for significance at 120 h, # = p < 0.0001. (C,G) Viability of GBM cells 48 h after reverse transfection with individual miRNA mimics and the combination (30 nM). (D,H) Clonogenic ability of GBM cells after reverse transfection with individual miRNA mimics and the combination (30 nM). A one-way ANOVA with Tukey test for multiple comparisons was utilized for experiments (C,D,G,H). p-values for comparisons against miRNA control: * p < 0.05; ** p < 0.01; *** p < 0.001; **** p < 0.0001. p-values for comparisons against miRNA Combo: † p < 0.05; †† p < 0.01.
Figure 4
Figure 4
miRNA combination inhibits glioma stem cell phenotype. (A) Mesenchymal glioma stem cell (GSC) viability 120 h after reverse transfection with 30 nM of single and combined miRNA mimics. (B) Phenotypic changes of GSCs in (A). (C) Proneural GSC viability 120 h after reverse transfection with 30 nM of single and combined miRNA mimics. (D) Phenotypic changes of GSCs in (C). A one-way ANOVA with Tukey test for multiple comparisons was utilized for all experiments. p-values for comparisons against miRNA control: * p < 0.05; ** p < 0.01; *** p < 0.001; **** p < 0.0001. p-values for comparisons against miRNA Combo: † p < 0.05; †† p < 0.01; ††† p < 0.001; †††† p < 0.0001. Scale bar represents 100 µm.
Figure 5
Figure 5
RNA-seq analysis of cells transfected with control and miRNA combo mimics. (A) Overlap between results of RNA-seq studies done in BE(2)C, GSCs 1919, and 3565 transfected with control vs. miRNA combination (miR-124, -128, and -137) mimics. Bar graphs: percentage of genes targeted by at least one of the transfected miRNAs identified in one, two, or all studies. Considering Venn-diagrams of down- and upregulated genes. As expected, we found an over-representation (253) in the downregulated genes (p-value = 0.000000602; 1.24-fold enrichment; Hypergeometric test) and an under-representation (188) of upregulated genes (p-value = 0.0000006; Hypergeometric test) shared by the three cell lines. (B) Number of genes targeted by at least one of the three transfected miRNAs appearing in the overlap of the three studies is much higher than expected by chance (p-value = 6.83 × 10−66). (C) Percentage of genes targeted by two or three of the transfected miRNAs appearing in the overlap of the three studies is much higher than the number observed in single studies. (D) Left: Genes targeted by all three miRNAs show greater decrease in expression versus genes targeted by two or a single miRNA. Right: Genes with multiple miRNA binding sites displayed higher silencing level in comparison to genes with a single miRNA binding site. (E) Percentage of miRNA target genes in all three, two, or single studies with increased expression in GBM in relation to normal brain (cortex) and stage 4 neuroblastoma compared to stage 1.
Figure 6
Figure 6
Gene ontology analysis of downregulated genes upon miRNA combo transfection. (A) Enriched biological processes and KEGG pathways identified by PANTHER and ShinyGO [32,33] associated with downregulated genes observed in at least two RNA-Seq analyses. (B) Network showing detected targets of the transfected miRNAs appearing in at least two RNA-Seq studies implicated in nervous system development and transcription regulation according to STRING [34]. (C) Oncogenes identified as targets of miR-124, miR-128, and miR-137 in the genomic analysis and their functions.
Figure 7
Figure 7
miRNA combo glioblastoma cells. (A,D) Left: representative aspects of U251 and U343 cells transfected with control or miRNA combination (miR-124, -128, and -137) clonogenic ability following exposure to ionizing radiation; right, quantification of clonogenic assay results. (B,E) Viability of U251 and U343 cells transfected with control or miRNA combination 48 h after exposure to ionizing radiation. (C,F) Results of traffic light reporter assays displaying ratios of homologous recombination to mutant NHEJ of U251 and U343 cells transfected with control or miRNA combination 48 h after transfection with the I-SceI plasmid. Student’s t-test: ** p < 0.01; *** p < 0.001.
Figure 8
Figure 8
Associated tumor suppressor miRNAs offer other choices of combination treatment. (A,B) Identified tumor suppressor miRNAs showing strong target overlap according to TargetScan predictions [52]. Numbers indicate overlapping targets and the percentage of overlap is indicated by shading. (C) Gene Ontology analysis according to PANTHER [32] shows enriched biological processes for genes predicted to be targeted by at least five of the miRNAs listed in (A). (D) BE(2)C, U251, 1123NS, and 84NS cells were transfected with the same molecular amount of single miRNA mimics (control, miR-101, miR-29, or miR-218) or combination of three miRNAs. First bar graph: Effect of miRNA transfection (single vs. combination) on BE(2)C cell differentiation at 120 h; neurite outgrowth was used as parameter of neuronal differentiation. Second, third, and fourth bar graphs: Effect of miRNA transfection (single vs. combination) on cell proliferation at 120 h. One-way ANOVA with Tukey test for multiple comparisons was used to analyze results of all experiments. p-values for comparisons against miRNA combination: † p < 0.05; †† p < 0.01; ††† p < 0.001; †††† p < 0.0001; **** p < 0.0001.

Similar articles

Cited by

References

    1. Gebert L.F.R., MacRae I.J. Regulation of microRNA function in animals. Nat. Rev. Mol. Cell Biol. 2019;20:21–37. doi: 10.1038/s41580-018-0045-7. - DOI - PMC - PubMed
    1. Park C.Y., Choi Y.S., McManus M.T. Analysis of microRNA knockouts in mice. Hum. Mol. Genet. 2010;19:R169–R175. doi: 10.1093/hmg/ddq367. - DOI - PMC - PubMed
    1. Jansson M.D., Lund A.H. MicroRNA and cancer. Mol. Oncol. 2012;6:590–610. doi: 10.1016/j.molonc.2012.09.006. - DOI - PMC - PubMed
    1. Piwecka M., Rolle K., Belter A., Barciszewska A.M., Zywicki M., Michalak M., Nowak S., Naskret-Barciszewska M.Z., Barciszewski J. Comprehensive analysis of microRNA expression profile in malignant glioma tissues. Mol. Oncol. 2015;9:1324–1340. doi: 10.1016/j.molonc.2015.03.007. - DOI - PMC - PubMed
    1. Chen Y., Stallings R.L. Differential patterns of microRNA expression in neuroblastoma are correlated with prognosis, differentiation, and apoptosis. Cancer Res. 2007;67:976–983. doi: 10.1158/0008-5472.CAN-06-3667. - DOI - PubMed

LinkOut - more resources