. 2021 Jan 14;22(2):795.
doi: 10.3390/ijms22020795.

Inhibition of Orexin/Hypocretin Neurons Ameliorates Elevated Physical Activity and Energy Expenditure in the A53T Mouse Model of Parkinson's Disease

Affiliations

Inhibition of Orexin/Hypocretin Neurons Ameliorates Elevated Physical Activity and Energy Expenditure in the A53T Mouse Model of Parkinson's Disease

Milos Stanojlovic et al. Int J Mol Sci. .

Abstract

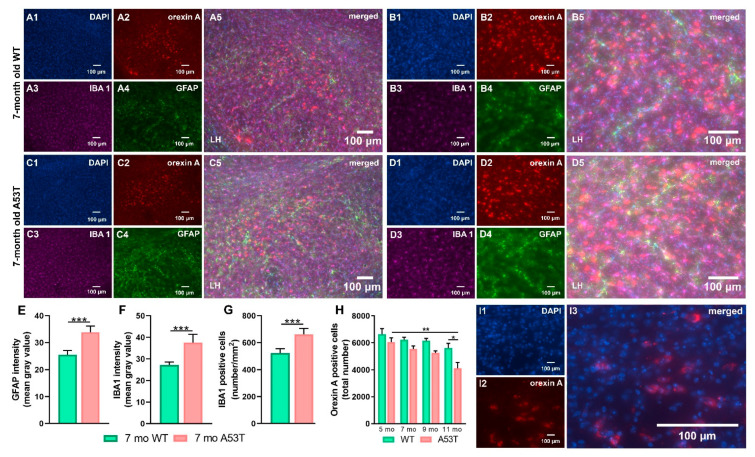
Aside from the classical motor symptoms, Parkinson's disease also has various non-classical symptoms. Interestingly, orexin neurons, involved in the regulation of exploratory locomotion, spontaneous physical activity, and energy expenditure, are affected in Parkinson's. In this study, we hypothesized that Parkinson's-disease-associated pathology affects orexin neurons and therefore impairs functions they regulate. To test this, we used a transgenic animal model of Parkinson's, the A53T mouse. We measured body composition, exploratory locomotion, spontaneous physical activity, and energy expenditure. Further, we assessed alpha-synuclein accumulation, inflammation, and astrogliosis. Finally, we hypothesized that chemogenetic inhibition of orexin neurons would ameliorate observed impairments in the A53T mice. We showed that aging in A53T mice was accompanied by reductions in fat mass and increases in exploratory locomotion, spontaneous physical activity, and energy expenditure. We detected the presence of alpha-synuclein accumulations in orexin neurons, increased astrogliosis, and microglial activation. Moreover, loss of inhibitory pre-synaptic terminals and a reduced number of orexin cells were observed in A53T mice. As hypothesized, this chemogenetic intervention mitigated the behavioral disturbances induced by Parkinson's disease pathology. This study implicates the involvement of orexin in early Parkinson's-disease-associated impairment of hypothalamic-regulated physiological functions and highlights the importance of orexin neurons in Parkinson's disease symptomology.

Keywords: Parkinson’s disease; neuromodulation; orexin.


Conflict of interest statement

The authors declare no conflict of interest.

Figures

Figure 1
Figure 1
Body composition and exploratory locomotion in 3-, 5-, 7-, 9-, and 11-month-old WT and A53T mice. A timeline of the experimental procedures (A). The open field test (OFT) was followed by food intake, body composition, spontaneous physical activity (SPA), and energy expenditure (EE) measurements. Aging induces increase in food intake in both WT and A53T mice, except in 11-month-old A53T mice. Compared to WT animals, A53T mice tend to consume more food (B). The increase in body weight is observable at both WT and A53T mice as they age (C). Differences in lean mass were not observed (D) however, age-associated increase in fat mass is significantly lower in A53T mice compared to WT (E) mice leading to significant differences in the fat to lean mass ratio in 9- and 11-month-old mice (F). As expected, WT mice showed an age-related reduction in distance covered in the OFT. Compared to WT mice, A53T mice covered more distance in the OFT and had an age-associated increase in distance covered in the OFT (G). (Body composition: n = 6/group; OFT, food intake: n = 9/group; p < 0.05 * vs. 3 mo; ! vs. 5 mo; @ vs. 7 mo; # vs. 9 mo; $ vs. 11 mo; & vs. group of the same age and other genotype).
Figure 2
Figure 2
Spontaneous physical activity (SPA) in 3-, 5-, 7-, 9-, and 11-month-old WT and A53T mice. SPA measured per hour during the 24 h period shown by the number of beam breaks for 3-month-old (A), 5-month-old (B), 7-month-old (C), 9-month-old (D), 11-month-old (E) WT and A53T mice. The white area represents the light phase while the gray area represents the dark phase. The A53T mice show increased SPA compared to WT mice during the light, inactive phase at 7 and 9 months of age (F). Increased SPA is also observed in A35T mice during the dark, active phase (G). Similar changes were observed in total daily SPA (H). In A53T mice, SPA increased with age and reached a peak at 7–9 months of age. (n = 6/group; p < 0.05 * vs. 3 mo; ! vs. 5 mo; @ vs. 7 mo; # vs. 9 mo; $ vs. 11 mo; & vs. group of the same age and other genotype).
Figure 3
Figure 3
Energy expenditure (EE) in 3-, 5-, 7-, 9-, and 11-month-old WT and A53T mice. EE measured per hour during the 24 h period shown as the EE/h/lean body mass (kcal/h/g) for 3-month-old (A), 5-month-old (B), 7-month-old (C), 9-month-old (D), 11-month-old (E) WT and A53T mice. The white area represents the light phase while the gray area represents the dark phase. F: Light, inactive phase; differences in EE were observed between 7-, 9-, and 11-month-old WT and A53T mice. (G) Dark, active phase, differences in EE were observed between 7- and 9-month-old WT and A53T mice. A significant reduction in EE was observed between 9- and 11-month-old A53T mice. (H) Total daily EE differences in EE were observed between 7- and 9-month-old WT and A53T mice (n = 6/group; p <0.05 # vs. 9 mo; $ vs. 11 mo; & vs. group of the same age and other genotype).
Figure 4
Figure 4
Quantification and localization of orexin A neuronal α-syn accumulations. Representative IF microphotographs of the DAPI in blue (A1,B1), orexin A in red (A2,B2), NeuN in yellow (A3,B3), p-α-syn in green (A4,B4), and merged images (A5,A6,B5,B6) in 7 mo WT (A) and A53T (B) mice showing the presence of the p-α-syn in the orexin neurons. (C) Percent of orexin neurons expressing p-α-syn defined as orexin A/p-α-syn co-localized cells in 7 mo A53T mice.
Figure 5
Figure 5
Expression of GFAP and IBA1 and number of the orexin A positive cells in the lateral hypothalamus (LH) of WT and A53T mice. Representative IF microphotographs of the DAPI in blue (A1,B1,C1,D1), orexin A in red (A2,B2,C2,D2), IBA1 in purple (A3,B3,C3,D3), GFAP in green (A4,B4,C4,D4), and the merged images (A5,B5,C5,D5) in 7 mo WT mice (A) low magnification; (B) high magnification and A53T mice (C) low magnification; (D) high magnification. Image J was used to quantify the intensity of GFAP and IBA1 staining and density of IBA1 positive cells. Increased expression of the GFAP (E) and IBA1 (F) was observed in A53T mice compared to WT mice. The A53T mice showed increased density of IBA1 positive cells (G). Unbiased stereology analysis showed reduced number of the orexin A positive neurons between 11 mo WT and A53T mice as well as age-associated loss of orexin neurons in A53T mice (H). Representative high magnification (63× oil) micrographs of the DAPI in blue (I1), orexin A in red (I2) and merged image (I3) used for unbiased stereology analysis. Densitometry and IBA1 positive cell numbers: n = 5/group; Student’s t-test; Unbiased stereology: n = 4/group; Two-way ANOVA, Sidak’s; * p < 0.05, ** p < 0.01, *** p < 0.005).
Figure 6
Figure 6
Quantification of inhibitory pre-synaptic terminals in the LH of 7-month-old WT and A53T mice. Representative high magnification IF microphotographs of the GAD65 and synaptophysin and merged images of the LH of 7 mo WT mice (A) and A53T mice (B). DAPI in blue (A1,B1), orexin A in red (A2,B2), synaptophysin in green (A3,B3) and GAD 65 in purple (A4,B4). Merged images: synaptophysin and GAD65 (A5,B5); DAPI, orexin A, synaptophysin and GAD65 (A6,B6). Immunocytochemistry-based assay showed reduced number of co-localized GAD65/synaptophysin pre-synaptic terminals in 7 mo A53T mice compared to WT littermates (C). Student’s t-test, n = 5/group; ** p < 0.01.
Figure 7
Figure 7
Effect of CNO on exploratory locomotion, water intake, SPA, and EE in 7-month-old male orx-Cre mice. Orx-Cre mice were subjected to intracranial injections of virus containing the control DREADD construct. For CNO effects on exploratory locomotion, animals were injected either with saline or CNO (3 mg/kg). Compared to saline-treated mice, CNO-treated mice showed no difference in distance traveled in the OFT (A). For CNO effects on water consumption, SPA and EE animals were either introduced to drinking water or CNO dissolved in drinking water (0.25 mg/mL). CNO dissolved in drinking water did not affect food intake (B) or water consumption (C). CNO treatment did not affect SPA or EE (D,E). OFT: n = 10/group; food intake, water intake, SPA, EE: n = 6/group; Student’s t-test.
Figure 8
Figure 8
Chemogenetic inhibition of orexin neurons reduces exploratory locomotion, SPA, and EE in 7-month-old orx-Cre/A53T mice. The timeline of the experimental procedures (A). Orx-Cre mice received virus containing control DREADD construct, while orx-Cre/A53T mice received virus containing either control DREADD or inhibitory DREADD construct. After four weeks of recovery time the OFT test was performed. One week following the OFT, body composition analysis was performed, and mice were introduced to CLAMS for SPA and EE measurements. Three days following CLAMS, mice were perfused, and brains were collected. Schematic diagram of AAV vector encoding DREADD-mCherry driven by human synapsin promoter (hSyn) promoter sequence and flanked by dual flox sites for recombination in the presence of Cre-recombinase. (B) Cre expression in orx-Cre mice is driven by the prepro-orexin promoter. Schematic representation of DREADD virus injection site within the lateral hypothalamus (LH). (C) DREADD-virus constructs were injected bilaterally (333 nL/5 min). (D) Chemogenetic inhibition of orexin neuronal activity reduced exploratory locomotion in 7-month-old orx-Cre/A53T mice. (E) DREADD induced inhibition of orexin neurons reduced SPA in both light and dark phase of the day, as well as total SPA (EG). Chemogenetic inhibitory intervention on orexin neurons did not affect light phase EE (H). However, inhibition of orexin neurons reduced EE in both dark phase and total EE (I,J). Food intake was not affected by chemogenetic intervention (K). (OFT: n = 10/group; food intake, SPA, EE: n = 6/group; OFT, SPA: One-way ANOVA, Tuckey; EE: ANCOVA, Sidak’s; p < 0.05 * vs. Orx-Cre cDREADD CNO; ! vs.Orx/Cre;A53T cDREADD CNO; @ vs. Orx/Cre;A53T iDREADD CNO).
Figure 9
Figure 9
DREADD expression confirmation. Representative images displaying viral expression of DREADDs in the LH (A), DAPI in blue (A1), orexin A positive neurons in purple (A2), mCherry positive neurons in red (A3), and merged images (A4). The percentage of OrxA/mCherry co-localized cells (B). Schematic drawings displaying the spread of viral expression along the LH; green orexin A expressing cells, red mCherry expressing cells (C). (n = 5/group).

Similar articles

Cited by

References

    1. Reeve A., Simcox E., Turnbull D. Ageing and Parkinson’s Disease: Why Is Advancing Age the Biggest Risk Factor? Ageing Res. Rev. 2014;14:19–30. doi: 10.1016/j.arr.2014.01.004. - DOI - PMC - PubMed
    1. Tysnes O.-B., Storstein A. Epidemiology of Parkinson’s Disease. J. Neural Transm. 2017;124:901–905. doi: 10.1007/s00702-017-1686-y. - DOI - PubMed
    1. Poewe W., Seppi K., Tanner C.M., Halliday G.M., Brundin P., Volkmann J., Schrag A.-E., Lang A.E. Parkinson Disease. Nat. Rev. Dis. Primer. 2017;3:17013. doi: 10.1038/nrdp.2017.13. - DOI - PubMed
    1. Moisan F., Kab S., Mohamed F., Canonico M., Guern M.L., Quintin C., Carcaillon L., Nicolau J., Duport N., Singh-Manoux A., et al. Parkinson Disease Male-to-Female Ratios Increase with Age: French Nationwide Study and Meta-Analysis. J. Neurol. Neurosurg. Psychiatry. 2016;87:952–957. doi: 10.1136/jnnp-2015-312283. - DOI - PMC - PubMed
    1. Kalia L.V., Lang A.E. Parkinson’s Disease. Lancet. 2015;386:896–912. doi: 10.1016/S0140-6736(14)61393-3. - DOI - PubMed

MeSH terms