

Matching Clinical Diagnosis and Amyloid Biomarkers in Alzheimer's Disease and Frontotemporal Dementia
- PMID: 33466854
- PMCID: PMC7830228
- DOI: 10.3390/jpm11010047
Matching Clinical Diagnosis and Amyloid Biomarkers in Alzheimer's Disease and Frontotemporal Dementia
Abstract
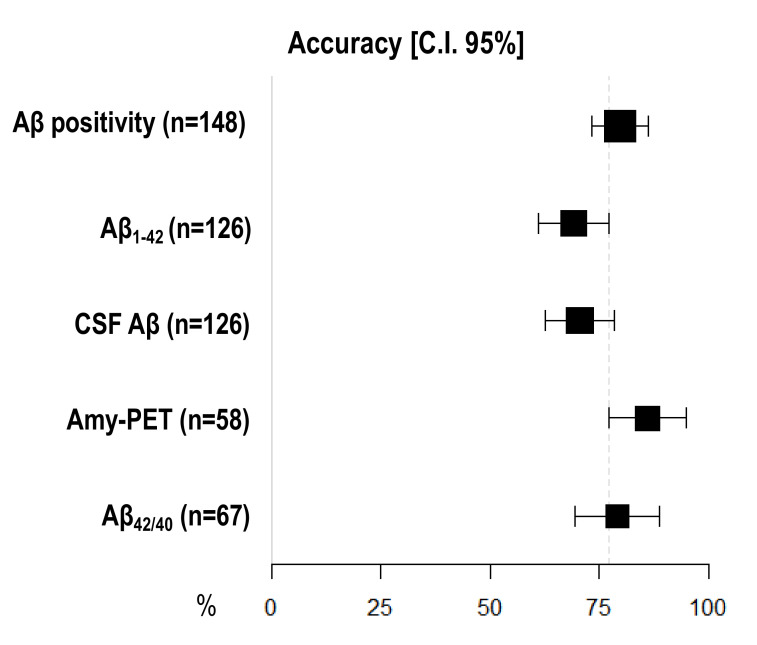
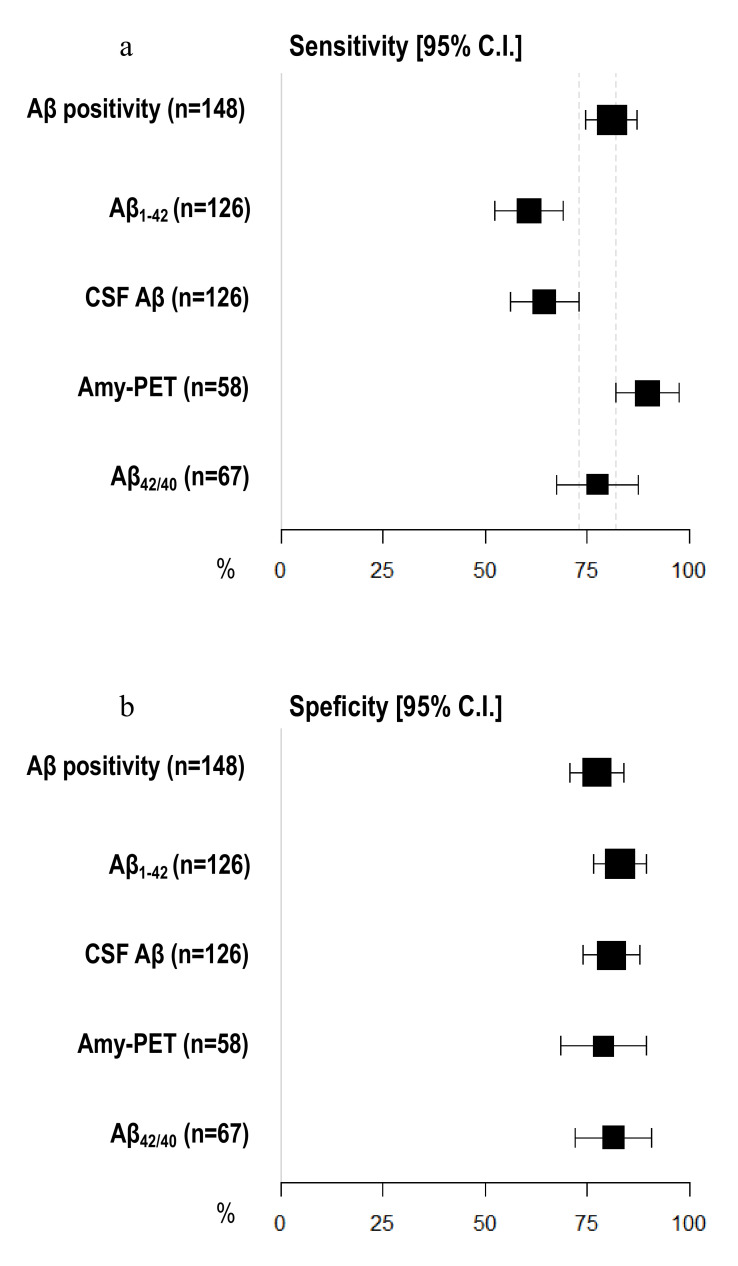
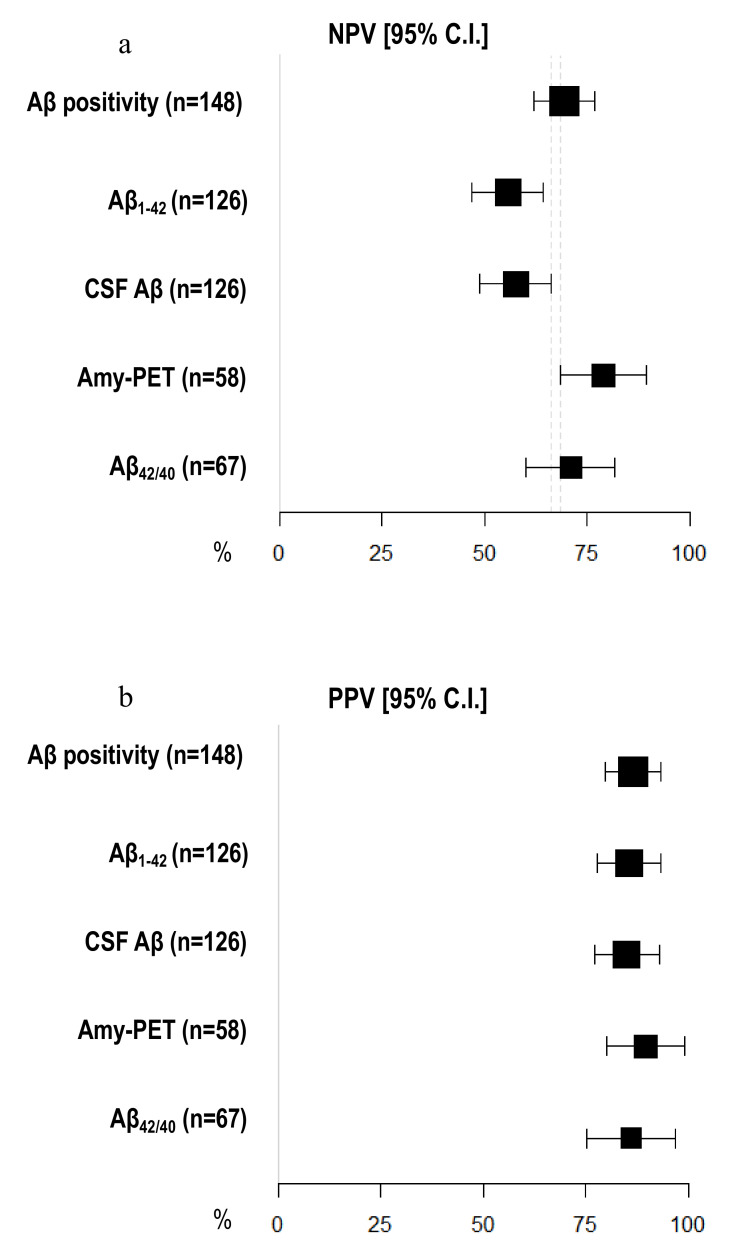
Background: The aims of this study were to compare the diagnostic accuracy, sensitivity, specificity, and positive and negative predictive values (PPV, NPV) of different cerebrospinal fluid (CSF) amyloid biomarkers and amyloid-Positron Emission Tomography (PET) in patients with a clinical diagnosis of Alzheimer's disease (AD) and Frontotemporal Dementia (FTD); to compare concordance between biomarkers; and to provide an indication of their use and interpretation.
Methods: We included 148 patients (95 AD and 53 FTD), who underwent clinical evaluation, neuropsychological assessment, and at least one amyloid biomarker (CSF analysis or amyloid-PET). Thirty-six patients underwent both analyses. One-hundred-thirteen patients underwent Apolipoprotein E (ApoE) genotyping.
Results: Amyloid-PET presented higher diagnostic accuracy, sensitivity, and NPV than CSF Aβ1-42 but not Aβ42/40 ratio. Concordance between CSF biomarkers and amyloid-PET was higher in FTD patients compared to AD cases. None of the AD patients presented both negative Aβ biomarkers.
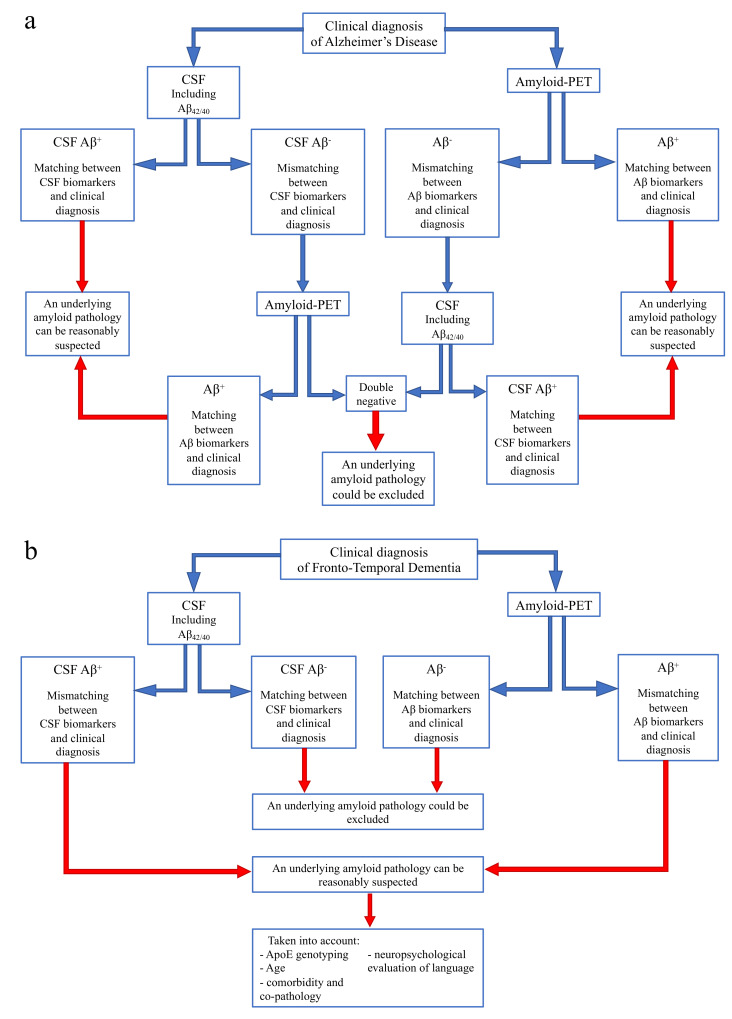
Conclusions: CSF Aβ42/40 ratio significantly increased the diagnostic accuracy of CSF biomarkers. On the basis of our current and previous data, we suggest a flowchart to guide the use of biomarkers according to clinical suspicion: due to the high PPV of both amyloid-PET and CSF analysis including Aβ42/40, in cases of concordance between at least one biomarker and clinical diagnosis, performance of the other analysis could be avoided. A combination of both biomarkers should be performed to better characterize unclear cases. If the two amyloid biomarkers are both negative, an underlying AD pathology can most probably be excluded.
Keywords: Alzheimer’s disease; CSF biomarkers; amyloid-PET; frontotemporal dementia.
Conflict of interest statement
The authors have no conflict of interest.
Figures
Similar articles
-
CSF biomarkers and amyloid PET: concordance and diagnostic accuracy in a MCI cohort.Acta Neurol Belg. 2019 Sep;119(3):445-452. doi: 10.1007/s13760-019-01112-8. Epub 2019 Mar 7. Acta Neurol Belg. 2019. PMID: 30847669
-
Clinic-Based Validation of Cerebrospinal Fluid Biomarkers with Florbetapir PET for Diagnosis of Dementia.J Alzheimers Dis. 2018;61(1):135-143. doi: 10.3233/JAD-170753. J Alzheimers Dis. 2018. PMID: 29154286
-
Concordance Between Cerebrospinal Fluid Biomarkers with Alzheimer's Disease Pathology Between Three Independent Assay Platforms.J Alzheimers Dis. 2018;61(1):169-183. doi: 10.3233/JAD-170128. J Alzheimers Dis. 2018. PMID: 29171991
-
Is ApoE ɛ 4 a good biomarker for amyloid pathology in late onset Alzheimer's disease?Transl Neurodegener. 2016 Nov 16;5:20. doi: 10.1186/s40035-016-0067-z. eCollection 2016. Transl Neurodegener. 2016. PMID: 27891223 Free PMC article. Review.
-
Amyloid beta protein and tau in cerebrospinal fluid and plasma as biomarkers for dementia: a review of recent literature.Curr Clin Pharmacol. 2008 May;3(2):123-31. doi: 10.2174/157488408784293723. Curr Clin Pharmacol. 2008. PMID: 18700307 Review.
Cited by
-
Beyond language: empathy and emotion recognition deficits in primary progressive aphasias.Neuroimage Clin. 2025 Jul 23;48:103852. doi: 10.1016/j.nicl.2025.103852. Online ahead of print. Neuroimage Clin. 2025. PMID: 40752112 Free PMC article.
-
Event-related potential markers of subjective cognitive decline and mild cognitive impairment during a sustained visuo-attentive task.Neuroimage Clin. 2025;45:103760. doi: 10.1016/j.nicl.2025.103760. Epub 2025 Feb 25. Neuroimage Clin. 2025. PMID: 40023055 Free PMC article.
-
PSEN2 Thr421Met Mutation in a Patient with Early Onset Alzheimer's Disease.Int J Mol Sci. 2022 Nov 1;23(21):13331. doi: 10.3390/ijms232113331. Int J Mol Sci. 2022. PMID: 36362122 Free PMC article.
-
Frontotemporal Dementia in Russia: Genetic Structure, Phenotypic Diversity, and Diagnostic Biomarkers.Basic Clin Neurosci. 2025 Jan-Feb;16(1):107-114. doi: 10.32598/bcn.2024.5797.1. Epub 2025 Jan 1. Basic Clin Neurosci. 2025. PMID: 40655089 Free PMC article.
-
Cerebral amyloid load determination in a clinical setting: interpretation of amyloid biomarker discordances aided by tau and neurodegeneration measurements.Neurol Sci. 2022 Apr;43(4):2469-2480. doi: 10.1007/s10072-021-05704-2. Epub 2021 Nov 5. Neurol Sci. 2022. PMID: 34739618
References
-
- McKhann G., Drachman D., Folstein M., Katzman R., Price D., Stadlan E.M. Clinical diagnosis of Alzheimer’s disease: Report of the NINCDS-ADRDA Work Group under the auspices of Department of Health and Human Services Task Force on Alzheimer’s Disease. Neurology. 1984;34:939–944. doi: 10.1212/WNL.34.7.939. - DOI - PubMed
-
- Lewczuk P., Esselmann H., Otto M., Maler J.M., Henkel A.W., Henkel M.K., Eikenberg O., Antz C., Krause W.R., Reulbach U., et al. Neurochemical diagnosis of Alzheimer’s dementia by CSF Abeta42, Abeta42/Abeta40 ratio and total tau. Neurobiol. Aging. 2004;25:273–281. doi: 10.1016/S0197-4580(03)00086-1. - DOI - PubMed
Grants and funding
LinkOut - more resources
Full Text Sources
Other Literature Sources
Medical
Miscellaneous
