. 2021 Jan 16;22(2):878.
doi: 10.3390/ijms22020878.

Computational Functional Genomics-Based AmpliSeq™ Panel for Next-Generation Sequencing of Key Genes of Pain

Affiliations

Computational Functional Genomics-Based AmpliSeq™ Panel for Next-Generation Sequencing of Key Genes of Pain

Dario Kringel et al. Int J Mol Sci. .

Abstract

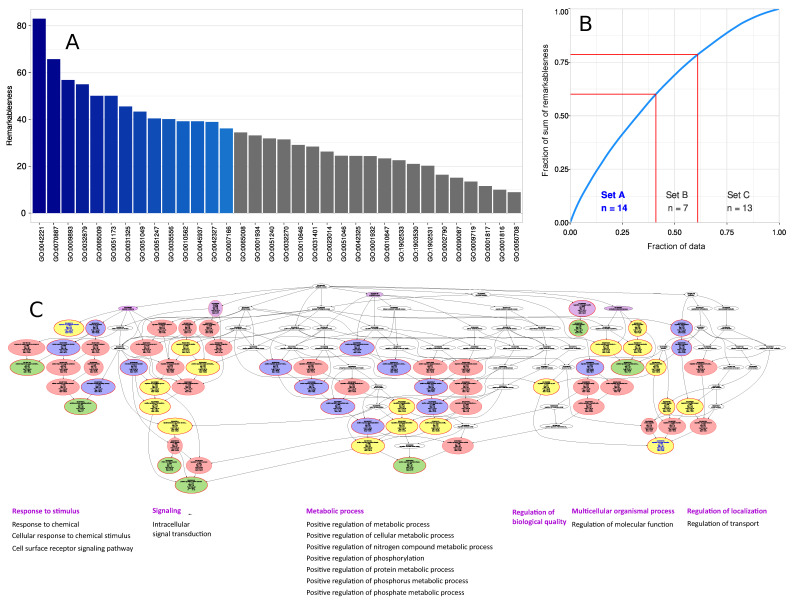
The genetic background of pain is becoming increasingly well understood, which opens up possibilities for predicting the individual risk of persistent pain and the use of tailored therapies adapted to the variant pattern of the patient's pain-relevant genes. The individual variant pattern of pain-relevant genes is accessible via next-generation sequencing, although the analysis of all "pain genes" would be expensive. Here, we report on the development of a cost-effective next generation sequencing-based pain-genotyping assay comprising the development of a customized AmpliSeq™ panel and bioinformatics approaches that condensate the genetic information of pain by identifying the most representative genes. The panel includes 29 key genes that have been shown to cover 70% of the biological functions exerted by a list of 540 so-called "pain genes" derived from transgenic mice experiments. These were supplemented by 43 additional genes that had been independently proposed as relevant for persistent pain. The functional genomics covered by the resulting 72 genes is particularly represented by mitogen-activated protein kinase of extracellular signal-regulated kinase and cytokine production and secretion. The present genotyping assay was established in 61 subjects of Caucasian ethnicity and investigates the functional role of the selected genes in the context of the known genetic architecture of pain without seeking functional associations for pain. The assay identified a total of 691 genetic variants, of which many have reports for a clinical relevance for pain or in another context. The assay is applicable for small to large-scale experimental setups at contemporary genotyping costs.

Keywords: computational functional genomics; data science; human genomics; knowledge discovery; next generation sequencing; pain genetics; pharmacogenomics.


Conflict of interest statement

The authors have declared that no further conflict of interest exist.

Figures

Figure 1
Figure 1
Assembly of the pain-relevant gene set forming the proposed NGS panel from various sources of evidence. The Venn diagram [90] visualizes the overlaps between the 29 key genes in the functional genomic representation of pain (“Lippmann” [17]) (subset 1 of the present NGS panel) and the two independent alternative proposals (“Mogil” [9] and “Zorina-Lichtenwalter” [10]) included as subset 2. The colors of the areas correspond to the colors of the adjacent names of the respective gene set. In addition, a set of d = 540 genes is indicated which have been empirically identified as relevant to pain and are either listed in the PainGenes database (http://www.jbldesign.com/jmogil/enter.html [7]) or were recognized as causing human hereditary diseases associated with extreme pain phenotypes, regulated in chronic pain in at least three studies including human association studies, or being targets of novel analgesics [91]. In addition, a further set of genes is included that belong to an NGS panel in an earlier approach to human genes relevant for the persistence of pain (”Kringel 1” [20]) The black dashed line surrounds the genes of the present NGS panel. The figure has been created using the R software package (version 4.0.2 for Linux; http://CRAN.R-project.org/ [92]) and the library “venn” (https://cran.r-project.org/package=venn [93]).
Figure 2
Figure 2
Technical detail of assay establishment and validation. (A): Pseudo-color image of the Ion 318TM v2 Chip plate showing percent loading across the physical surface. This sequencing run had a 76% loading, which ensures a high Ion Sphere Particles (ISP) density. Every 318 chip contains 11 million wells and the color scale on the right side conduces as a loading indicator. Deep red coloration stays for a 100% loading, which means that every well in this area contains an ISP (templated and non-templated) whereas deep blue coloration implies that the wells in this area are empty. (B): Alignment of segments of the ion torrent sequence of the COMT gene as Golden Helix Genome Browse® readouts versus the same sequence according to an externally predicted Sanger electropherogram. The figure has been created using the original outputs of the Ion PGM System (Life Technologies, Darmstadt, Germany) and the Golden Helix Genome Browse® software (Version 2.0.4, Golden Helix, Bozeman, MT, USA).
Figure 3
Figure 3
Number and localization of variants identified using the present AmpliSeqTM panel, in relation to the read DNA length per gene. (A) Stacked bar plot representing the number of genetic variants per gene included in the assay, categorized for the gene locations. The horizontal size of the cells is proportional to the number of nucleotides assayed in the respective gene. The genes are ordered for descending read length. Variants were not found in three genes (IFNG, GSTM1 and CXCL8; indicated in blue gene symbols at the x-axis), which are among the shortest genes. (B) Scatterplot of the total number of variants versus the number of nucleotides read for the respective gene in the present assay. A robust regression line with 95% confidence interval is overlaid on the dot plot. The genes where no variants had been detected are indicated as blue dots. Please note the decreasing order of gene length on the abscissa to match the main panel. The figure has been created using the R software package (version 4.0.2 for Linux, city, http://CRAN.R-project.org/ [92]) and the R libraries “ggplot2” (https://cran.r-project.org/package=ggplot2 [96]). UTR: untranslated region.
Figure 4
Figure 4
Computational functional genomics perspective on the biological processes in which the genes analyzed with the proposed NGS panel are involved. The figure displays the results of an overrepresentation analysis (ORA; p-value threshold, tp = 5 × 10⁻¹⁵ and Bonferroni α correction) of the 72 genes included in the present NGS panel (Table 1). (A) Bar plot of the gene relevance in the functional genomics representation of the present gene set. As a basis for the selection of the most relevant terms to describe the directed acyclic graph (DAG [97]) representing the polyhierarchical structure of the Gene Ontology database, i.e., the terms that can serve as headlines for each branch of the DAG, the remarkableness measure was previously introduced [98]. The bar plot shows the relevance of GO terms in decreasing order of the remarkableness measure. The blue bars indicate the most relevant terms selected by an item categorization technique, implemented as a computed ABC analysis [99]. (B) The ABC plot (blue line) shows the cumulative distribution function of the remarkableness measure with the limits between sets A, B and C indicate as red lines. The results show that 14 GO terms belonged to ABC set “A” and were therefore considered as most relevant to the DAG. (C) Top-down representation of the annotations (GO terms) representing a systems biology perspective of the biological processes modulated by the set of 72 genes included in the present NGS panel. Each ellipse represents a GO term. The graphical representation follows the standard of the GO knowledge base, where GO terms are related to each other by “is-a”, “part-of”, “has-a” and “regulates” relationships forming a branching polyhierarchy organized in a directed acyclic graph (DAG [97]). The color coding is as follows: No color: GO terms that are important for the DAG’s structure but do not have a significant p-value in Fisher’s exact tests. Red: Significantly overrepresented nodes. Green: Terms at the end (detail) of a branch of the DAG. In addition, the node’s text will be colored in blue to indicate that this node is a detail. Yellow: Significant nodes with highest remarkableness in each path from a detail to the root, i.e., the so-called “headlines”. The margins indicate over by its red color. Violet: Functional areas, i.e., terms selected to describe the parts below them in the DAG most concisely. The figure has been created using the R software package (version 4.0.2 for Linux; http://CRAN.R-project.org/ [92]) and the R libraries “ABCanalysis” (http://cran.r-project.org/package=ABCanalysis [99]), “ggplot2” (https://cran.r-project.org/package=ggplot2 [96]) and “dbtORA” (https://github.com/IME-TMP-FFM/dbtORA [100]).
Figure 5
Figure 5
Detail of the directed acyclic graph (DAG [97]) shown in Figure 4, displaying the polyhierarchical structure of the Gene Ontology database (“point of view”) below the GO term “response to stimulus” (GO:0050896). This was one of the major biological processes identified by a functional genomics analysis aiming at characteristics of pain and defined as “Any process that results in a change in state or activity of a cell or an organism (in terms of movement, secretion, enzyme production, gene expression, etc.) as a result of a stimulus. The process begins with detection of the stimulus and ends with a change in state or activity or the cell or organism” [19]. The color coding is as follows: No color: GO terms that are important for the DAG’s structure but do not have a significant p-value in Fisher’s exact tests. Red: Significantly overrepresented nodes. Green: Terms at the end (detail) of a branch of the DAG. In addition, the node’s text will be colored in blue to indicate that this node is a detail. Yellow: Significant nodes with highest remarkableness in each path from a detail to the root, i.e., the so-called “headlines”. The margins indicate over by its red color. Violet: Functional areas, i.e., terms selected to describe the parts below them in the DAG most concisely. The figure has been created using the R software package (version 4.0.2 for Linux; http://CRAN.R-project.org/ [92]) and the library “dbtORA” (https://github.com/IME-TMP-FFM/dbtORA [100]).

Similar articles

Cited by

References

    1. Lötsch J., Lippmann C., Kringel D., Ultsch A. Integrated computational analysis of genes associated with human hereditary insensitivity to pain. A drug repurposing perspective. Front. Neurosci. 2017;10:252. doi: 10.3389/fnmol.2017.00252. - DOI - PMC - PubMed
    1. Bennett D.L., Woods C.G. Painful and painless channelopathies. Lancet Neurol. 2014;13:587–599. doi: 10.1016/S1474-4422(14)70024-9. - DOI - PubMed
    1. Mogil J.S. The genetic mediation of individual differences in sensitivity to pain and its inhibition. Proc. Natl. Acad. Sci. USA. 1999;96:7744–7751. doi: 10.1073/pnas.96.14.7744. - DOI - PMC - PubMed
    1. Navratilova E., Rau J., Oyarzo J., Tien J., Mackenzie K., Stratton J., Remeniuk B., Schwedt T., Anderson T., Dodick D., et al. CGRP-dependent and independent mechanisms of acute and persistent post-traumatic headache following mild traumatic brain injury in mice. Cephalalgia. 2019;39:1762–1775. doi: 10.1177/0333102419877662. - DOI - PubMed
    1. Lötsch J., Geisslinger G., Tegeder I. Genetic modulation of the pharmacological treatment of pain. Pharm. Ther. 2009;124:168–184. doi: 10.1016/j.pharmthera.2009.06.010. - DOI - PubMed

MeSH terms