. 2021 Jan 15;10(1):158.
doi: 10.3390/plants10010158.

Image-Based Methods to Score Fungal Pathogen Symptom Progression and Severity in Excised Arabidopsis Leaves

Affiliations

Image-Based Methods to Score Fungal Pathogen Symptom Progression and Severity in Excised Arabidopsis Leaves

Mirko Pavicic et al. Plants (Basel). .

Abstract

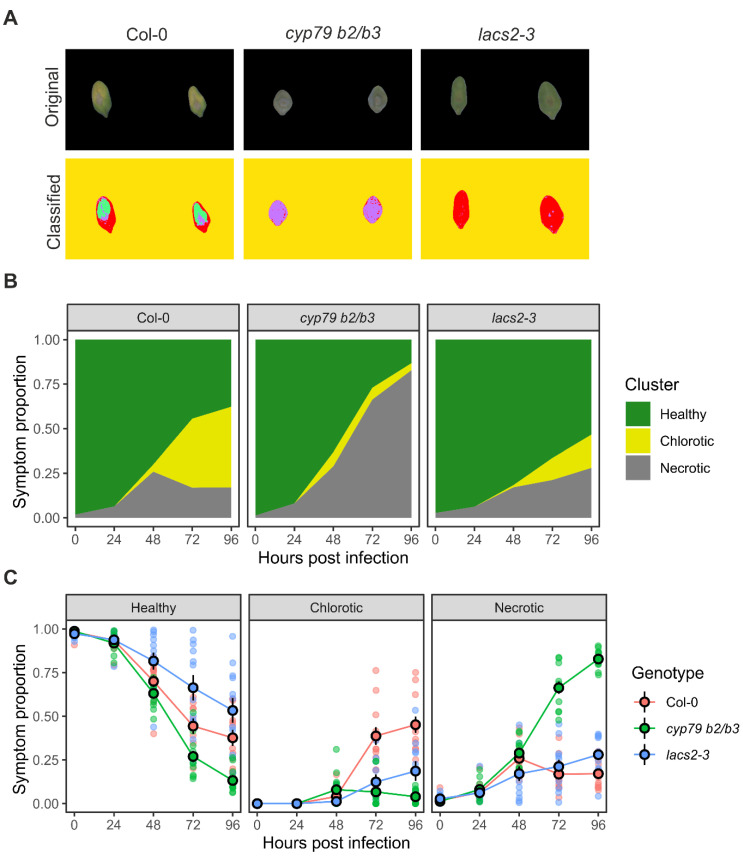
Image-based symptom scoring of plant diseases is a powerful tool for associating disease resistance with plant genotypes. Advancements in technology have enabled new imaging and image processing strategies for statistical analysis of time-course experiments. There are several tools available for analyzing symptoms on leaves and fruits of crop plants, but only a few are available for the model plant Arabidopsis thaliana (Arabidopsis). Arabidopsis and the model fungus Botrytis cinerea (Botrytis) comprise a potent model pathosystem for the identification of signaling pathways conferring immunity against this broad host-range necrotrophic fungus. Here, we present two strategies to assess severity and symptom progression of Botrytis infection over time in Arabidopsis leaves. Thus, a pixel classification strategy using color hue values from red-green-blue (RGB) images and a random forest algorithm was used to establish necrotic, chlorotic, and healthy leaf areas. Secondly, using chlorophyll fluorescence (ChlFl) imaging, the maximum quantum yield of photosystem II (Fv/Fm) was determined to define diseased areas and their proportion per total leaf area. Both RGB and ChlFl imaging strategies were employed to track disease progression over time. This has provided a robust and sensitive method for detecting sensitive or resistant genetic backgrounds. A full methodological workflow, from plant culture to data analysis, is described.

Keywords: Arabidopsis; Botrytis; chlorophyll fluorescence; disease symptom; high-throughput; imaging sensors; plant phenotyping.


Conflict of interest statement

The authors declare no conflict of interest.

Figures

Figure 1
Figure 1
Arabidopsis leaf infection workflow. (A) The workflow of the infection assay used in this study starting from high density sowing of Arabidopsis seeds, potting of seedlings into individual pots, Botrytis conidia culture, inoculation of excised Arabidopsis leaves, imaging by red-green-blue (RGB) and chlorophyll fluorescence (ChlFl) sensors, online image storage and post processing, and data analysis; (B) Eight six-well plates arranged on the imaging tray; (C) Control lines Col-0, cyp79 b2/b3, and lacs2-3 used in this study, after 96 h post inoculation. PCTA medium, potato carrot tomato agar medium; ChlFl, chlorophyll fluorescence imaging; RGB imaging, red-green-blue imaging; Col-0, wild type Columbia-0 accession; cyp79 b2/b3, the Botrytis-susceptible cytochrome p450 79-b2 and -b3 (cyp79 b2/b3) double mutant; lacs2-3, the Botrytis-resistant long-chain acyl-coa synthase2 (lacs2-3) mutant.
Figure 2
Figure 2
Image processing workflow for RGB (red-green-blue) and ChlFl (chlorophyll fluorescence) images. For RGB images, four categories were depicted, i.e., background, healthy, chlorotic, and necrotic, and are indicated by yellow, red, green, and purple colors, respectively. For ChlFl images, an Fo masked image was used to detect the leaf Fv/Fm to record the photosynthetic capacity on the leaf and the two together to assign pixel thresholds for disease. Both image derived datasets were processed in FIJI and analyzed by R scripts. Fo, minimum fluorescence; Fv, variable fluorescence; Fm, maximum fluorescence; Fv/Fm, maximum quantum yield of the photosystem II.
Figure 3
Figure 3
Validation of the RGB pixel classification strategy for Botrytis disease scoring. (A) Images of original RGB images (above) and pixel classification results with color codes (below); (B) Stacked color hue plots of the diseased area progression for the symptom categories healthy, chlorotic, and necrotic; (C) Disease progression area for healthy, chlorotic, and necrotic categories. Circles, mean; error bars, standard error of the mean; Col-0, wild type Columbia-0 accession; cyp79 b2/b3, the Botrytis-susceptible cytochrome p450 79-b2 and -b3 double mutant; lacs2-3, the Botrytis-resistant long-chain acyl-coa synthase2 mutant.
Figure 4
Figure 4
Chlorophyll fluorescence threshold pixel count and mean pixel value strategies for Botrytis disease scoring. (A) False color Fv/Fm image. Yellow pixels represent healthy leaf areas, while green and blue represent symptomatic areas; (B) Density plot for the distributions of pixel intensities for wild type Col-0, cyp79 b2/b3, and lacs2-3, at 72 h post infection, with an arbitrary pixel threshold (≤0.75) to consider a pixel as symptomatic (dashed line); (C) Symptomatic pixel count and (D) disease severity (mean pixel value over the leaf) differences among Col-0, cyp79 b2/b3, and lacs2-3. Circles represent the mean, and the error bars the standard deviation from the mean. Transparent points in the background represent the actual individual leaves measured with a soft jittering to prevent point overlapping. Col-0, wild type Columbia-0 accession; cyp79 b2/b3, the Botrytis-susceptible cytochrome p450 79-b2 and -b3 double mutant; lacs2-3, the Botrytis-resistant long-chain acyl-coa synthase2 mutant.
Figure 5
Figure 5
Modeling strategy for inference. (A) Base model without indicating leaves genotype; (B) Full model including leaves genotype term. Col-0, wild type Columbia-0 accession; lacs2-3, the Botrytis-resistant long-chain acyl-coa synthase2 (lacs2-3) mutant.

References

    1. Fahlgren N., Gehan M.A., Baxter I. Lights, camera, action: High-throughput plant phenotyping is ready for a close-up. Curr. Opin. Plant Biol. 2015;24:93–99. doi: 10.1016/j.pbi.2015.02.006. - DOI - PubMed
    1. Furbank R.T., Tester M. Phenomics-technologies to relieve the phenotyping bottleneck. Trends Plant Sci. 2011;16:635–644. doi: 10.1016/j.tplants.2011.09.005. - DOI - PubMed
    1. Bock C.H., Poole G.H., Parker P.E., Gottwald T.R. Plant Disease Severity Estimated Visually, by Digital Photography and Image Analysis, and by Hyperspectral Imaging. Crit. Rev. Plant Sci. 2010;29:59–107. doi: 10.1080/07352681003617285. - DOI
    1. Chaerle L., Hagenbeek D., De Bruyne E., Valcke R., Van Der Straeten D. Thermal and Chlorophyll-Fluorescence Imaging Distinguish Plant-Pathogen Interactions at an Early Stage. Plant Cell Physiol. 2004;45:887–896. doi: 10.1093/pcp/pch097. - DOI - PubMed
    1. Rolfe S.A., Scholes J.D. Chlorophyll fluorescence imaging of plant–pathogen interactions. Protoplasma. 2010;247:163–175. doi: 10.1007/s00709-010-0203-z. - DOI - PubMed

LinkOut - more resources