

The Genetic Basis for Salivary Gland Barriers to Arboviral Transmission
- PMID: 33467430
- PMCID: PMC7830681
- DOI: 10.3390/insects12010073
The Genetic Basis for Salivary Gland Barriers to Arboviral Transmission
Abstract
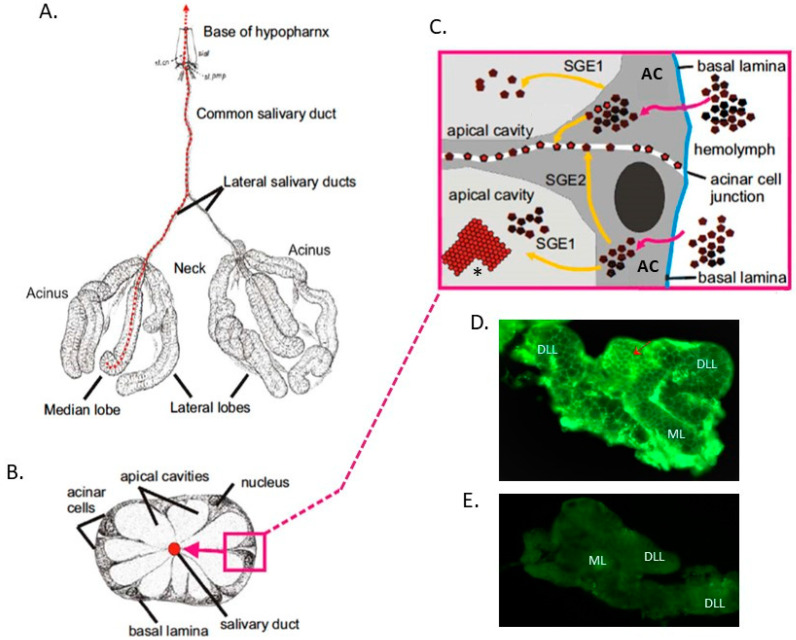
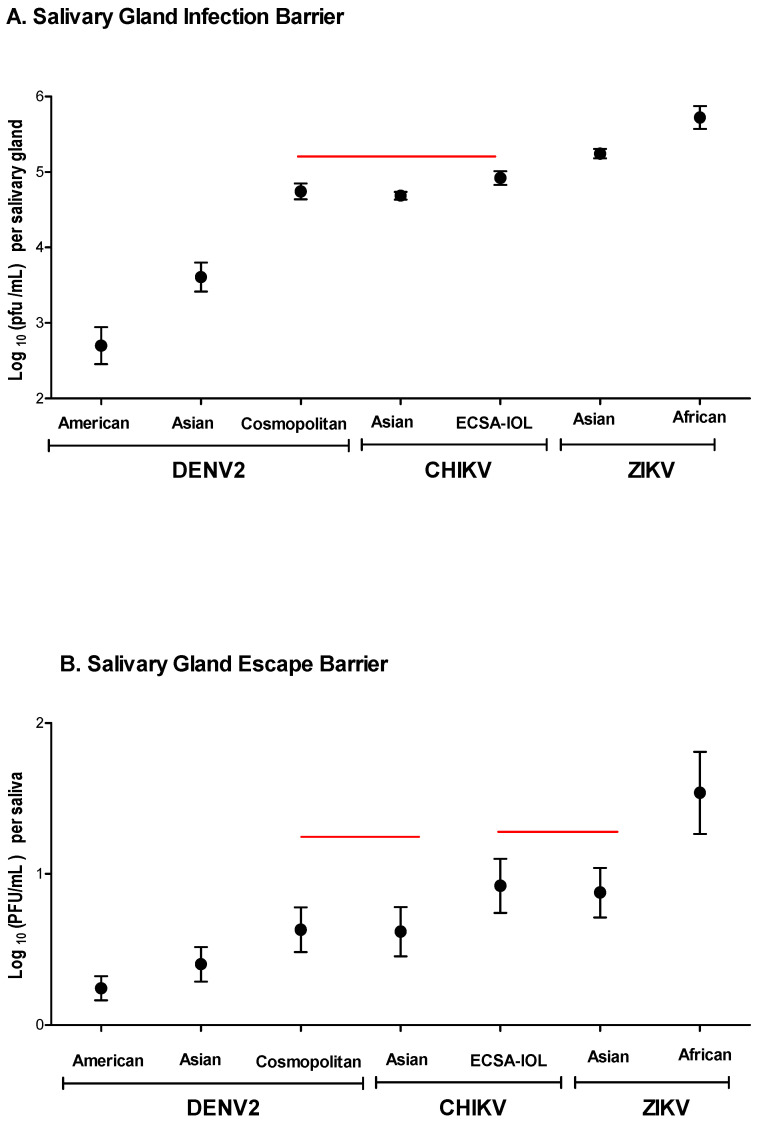
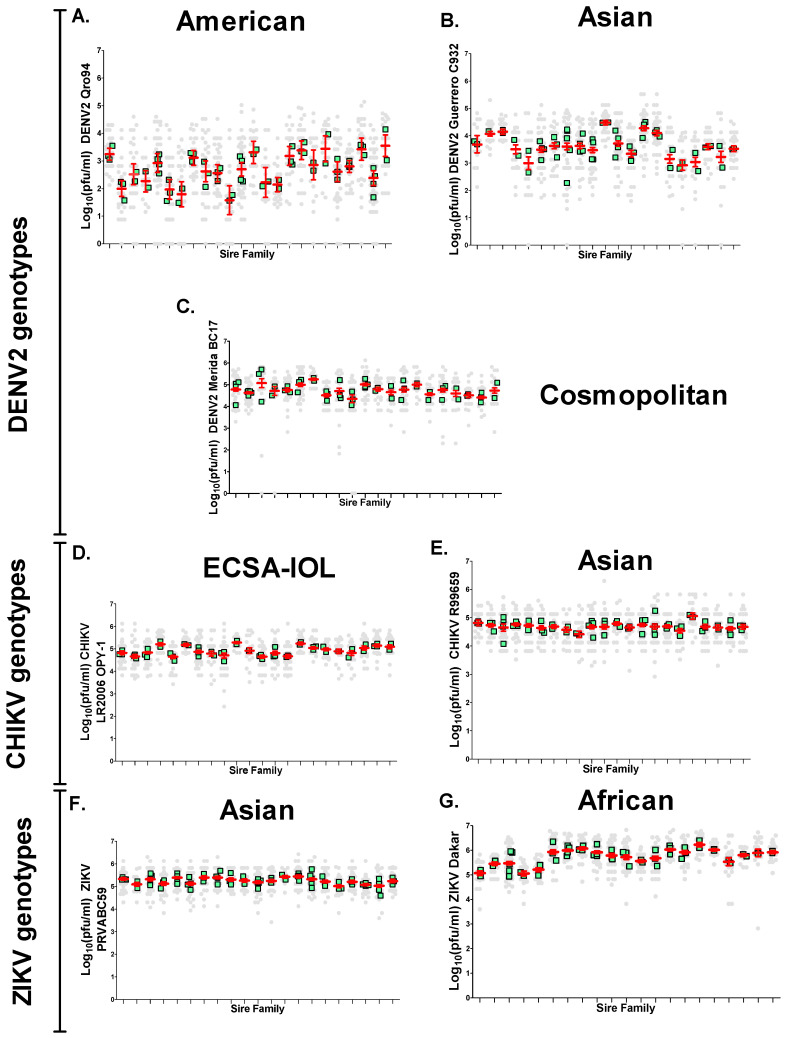
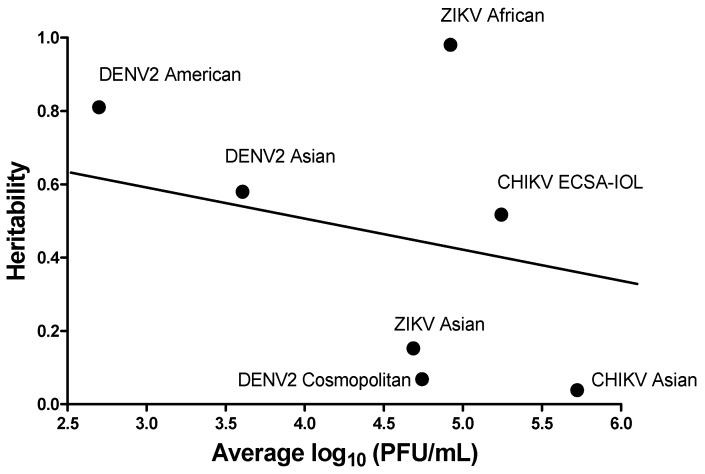
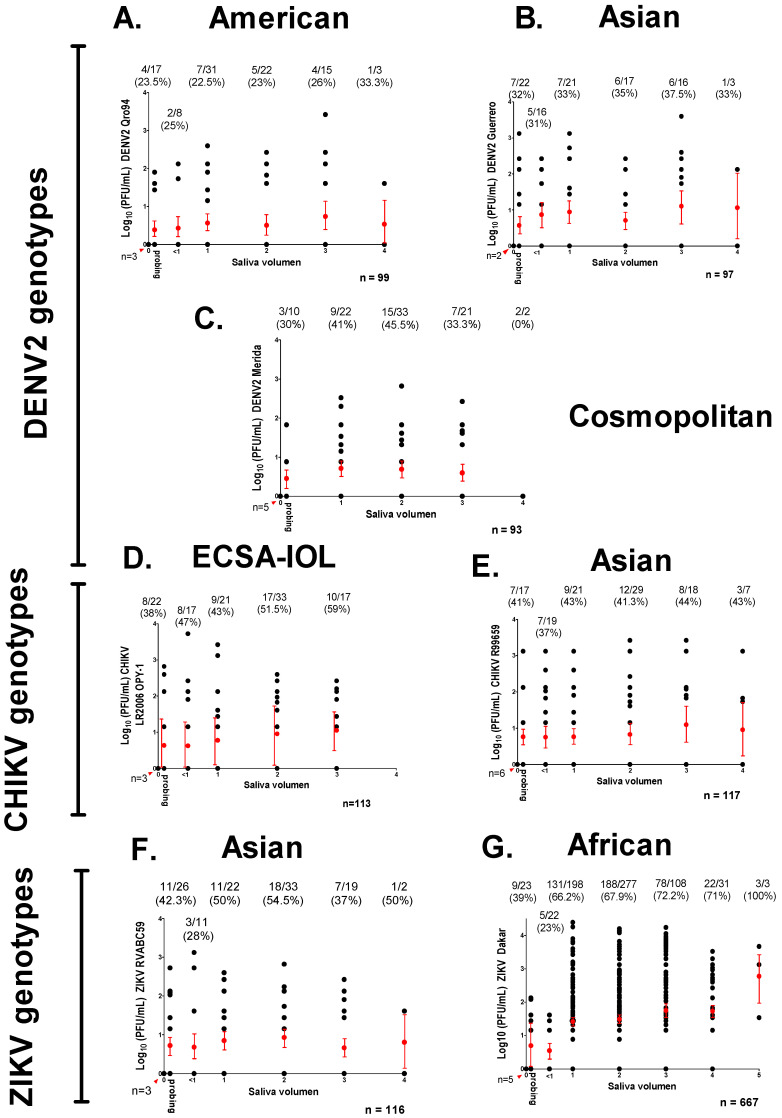
Arthropod-borne viruses (arboviruses) infect mosquito salivary glands and then escape to saliva prior to virus transmission. Arbovirus transmission from mosquitoes can be modulated by salivary gland infection barriers (SGIBs) and salivary gland escape barriers (SGEBs). We determined the influence of SGIBs and SGEBs by estimating the quantitative genetic contributions of Aedes aegypti half-sib families (Mapastepec, Mexico) infected with three dengue 2 (DENV2), two chikungunya (CHIKV), and two Zika (ZIKV) genotypes. We determined virus titer per salivary gland and saliva at seven days post-infection and virus prevalence in the half-sib population. CHIKV or ZIKV genotypes did not present SGIB, whereas DENV2 genotypes showed low rates of SGIB. However, virus titer and prevalence due to additive genetic factors in the half-sib family displayed a significant narrow-sense heritability (h2) for SGIB in two of the three DENV2 genotypes and one CHIKV and one ZIKV genotype. SGEBs were detected in all seven virus strains: 60-88% of DENV2 and 48-62% of CHIKV or ZIKV genotype infections. SGEB h2 was significant for all CHIKV or ZIKV genotypes but not for any of the DENV2 genotypes. SGIBs and SGEBs exhibited classical gene-by-gene interaction dynamics and are influenced by genetic factors in the mosquito and the virus.
Keywords: Aedes aegypti; arbovirus; quantitative genetics; salivary gland escape barriers; salivary gland infection barriers.
Conflict of interest statement
The authors declare no conflict of interest. The funders had no role in the design of the study; in the collection, analyses, or interpretation of data; in the writing of the manuscript; or in the decision to publish the results.
Figures
Similar articles
-
wMel limits zika and chikungunya virus infection in a Singapore Wolbachia-introgressed Ae. aegypti strain, wMel-Sg.PLoS Negl Trop Dis. 2017 May 19;11(5):e0005496. doi: 10.1371/journal.pntd.0005496. eCollection 2017 May. PLoS Negl Trop Dis. 2017. PMID: 28542240 Free PMC article.
-
High resolution proteomics of Aedes aegypti salivary glands infected with either dengue, Zika or chikungunya viruses identify new virus specific and broad antiviral factors.Sci Rep. 2021 Dec 8;11(1):23696. doi: 10.1038/s41598-021-03211-0. Sci Rep. 2021. PMID: 34880409 Free PMC article.
-
Analysis of Salivary Glands and Saliva from Aedes albopictus and Aedes aegypti Infected with Chikungunya Viruses.Insects. 2019 Feb 1;10(2):39. doi: 10.3390/insects10020039. Insects. 2019. PMID: 30717086 Free PMC article.
-
Current concerns and perspectives on Zika virus co-infection with arboviruses and HIV.J Autoimmun. 2018 May;89:11-20. doi: 10.1016/j.jaut.2018.01.002. Epub 2018 Jan 17. J Autoimmun. 2018. PMID: 29352633 Free PMC article. Review.
-
Aedes vittatus (Bigot) mosquito: An emerging threat to public health.J Vector Borne Dis. 2017 Oct-Dec;54(4):295-300. doi: 10.4103/0972-9062.225833. J Vector Borne Dis. 2017. PMID: 29460858 Review.
Cited by
-
Performing Immunohistochemistry in Mosquito Salivary Glands.Cold Spring Harb Protoc. 2022 Oct 3;2022(10):Pdb.top107699. doi: 10.1101/pdb.top107699. Cold Spring Harb Protoc. 2022. PMID: 35960615 Free PMC article.
-
Mosquito Cell Atlas: A single-nucleus transcriptomic atlas of the adult Aedes aegypti mosquito.bioRxiv [Preprint]. 2025 Feb 25:2025.02.25.639765. doi: 10.1101/2025.02.25.639765. bioRxiv. 2025. PMID: 40060408 Free PMC article. Preprint.
-
Knockdown resistance allele L1014F introduced by CRISPR/Cas9 is not associated with altered vector competence of Anopheles gambiae for o'nyong nyong virus.PLoS One. 2023 Aug 10;18(8):e0288994. doi: 10.1371/journal.pone.0288994. eCollection 2023. PLoS One. 2023. PMID: 37561739 Free PMC article.
-
Relevant Day/Night Temperatures Simulating Belgian Summer Conditions Reduce Japanese Encephalitis Virus Dissemination and Transmission in Belgian Field-Collected Culex pipiens Mosquitoes.Viruses. 2023 Mar 16;15(3):764. doi: 10.3390/v15030764. Viruses. 2023. PMID: 36992473 Free PMC article.
-
Saliva collection via capillary method may underestimate arboviral transmission by mosquitoes.Parasit Vectors. 2022 Mar 24;15(1):103. doi: 10.1186/s13071-022-05198-7. Parasit Vectors. 2022. PMID: 35331315 Free PMC article.
References
-
- Kenney J.L., Brault A.C. The role of environmental, virological and vector interactions in dictating biological trans-mission of arthropod-borne viruses by mosquitoes. Adv. Virus Res. 2014;89:39–83. - PubMed
-
- Murphy F.A., Whitfield S.G., Sudia W.D., Chamberlain R.W. Interactions of Vector with Verte-Brate Pathogenic Viruses. Academic Press; Cambridge, MA, USA: 1975. Invertebrate Immunity.
Grants and funding
LinkOut - more resources
Full Text Sources
Other Literature Sources
