. 2021 Jan 15;9(1):173.
doi: 10.3390/microorganisms9010173.

Chlamydia Uses K+ Electrical Signalling to Orchestrate Host Sensing, Inter-Bacterial Communication and Differentiation

Affiliations

Chlamydia Uses K+ Electrical Signalling to Orchestrate Host Sensing, Inter-Bacterial Communication and Differentiation

Susan C Andrew et al. Microorganisms. .

Abstract

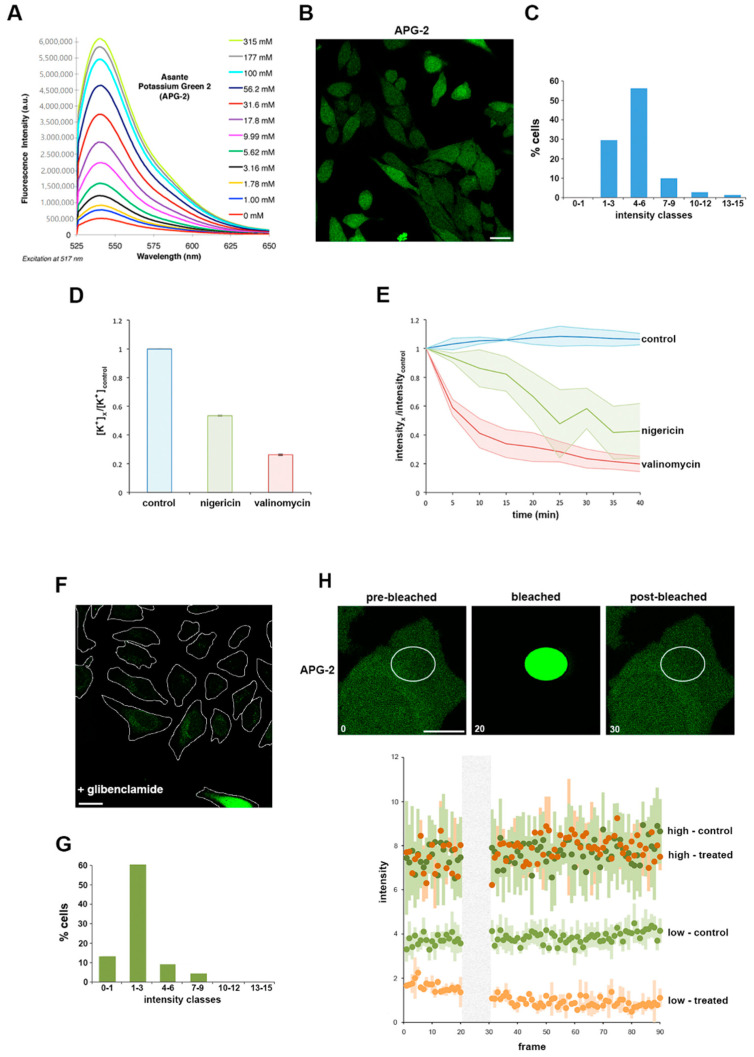
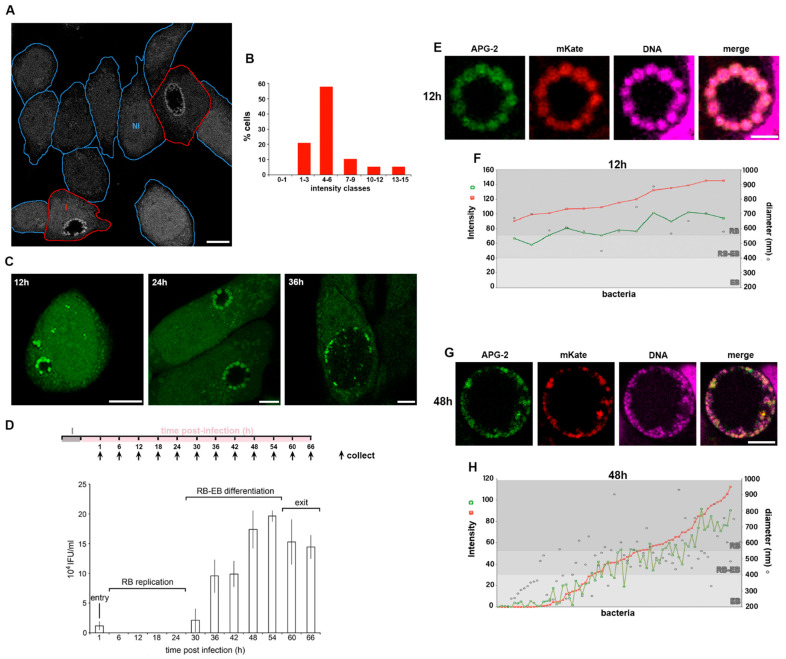
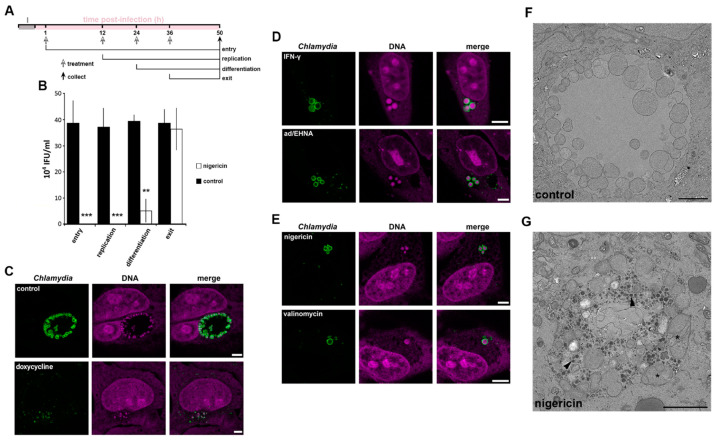
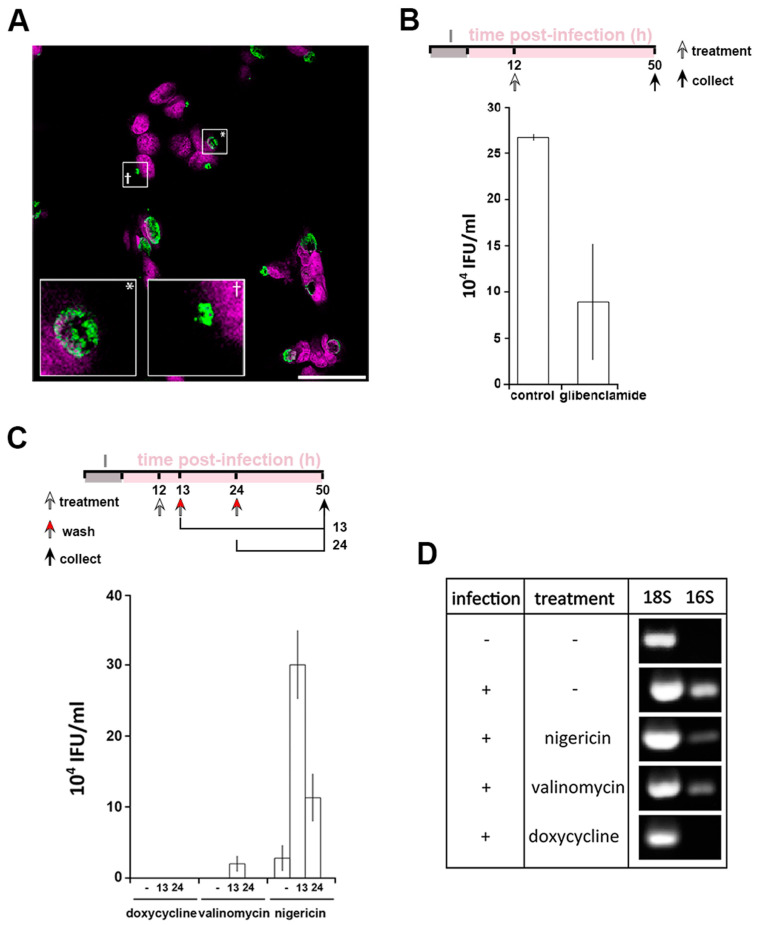
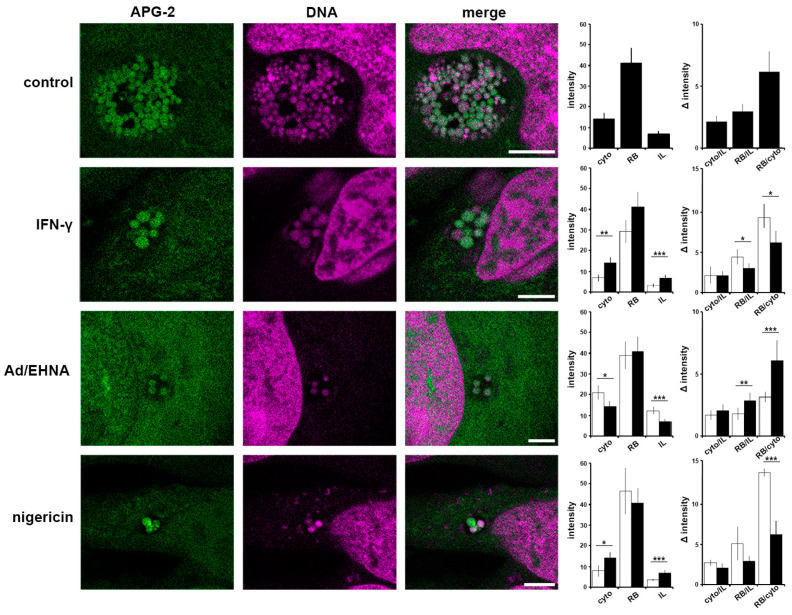
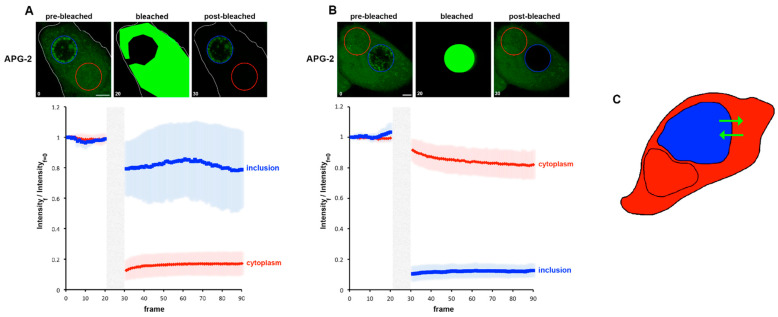
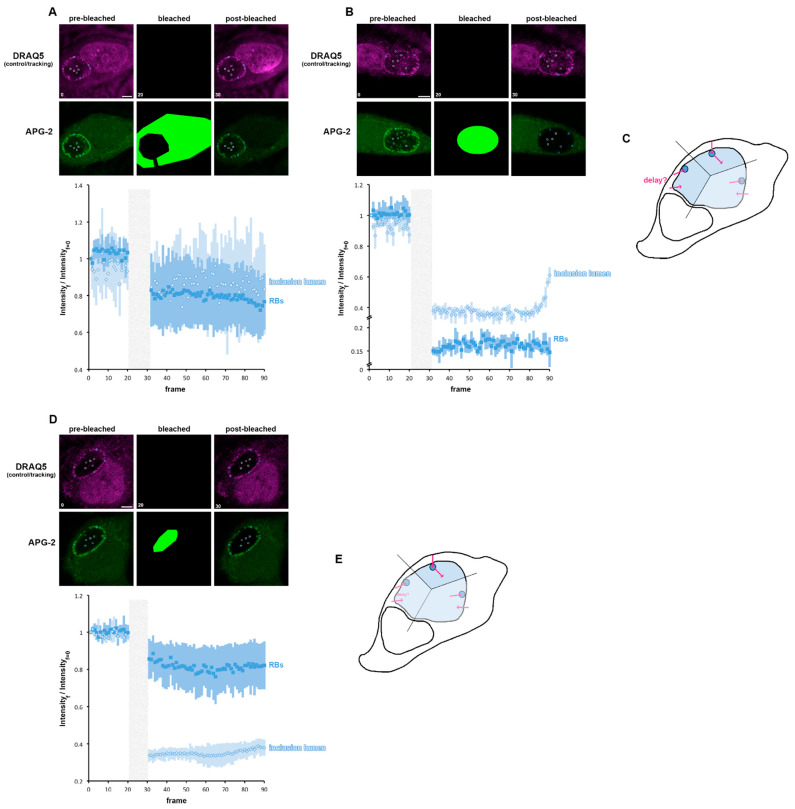
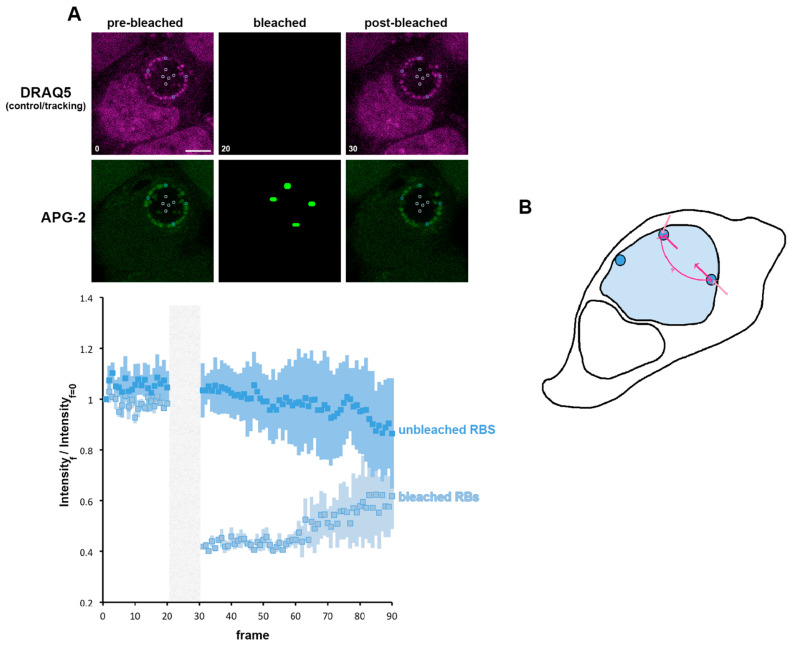
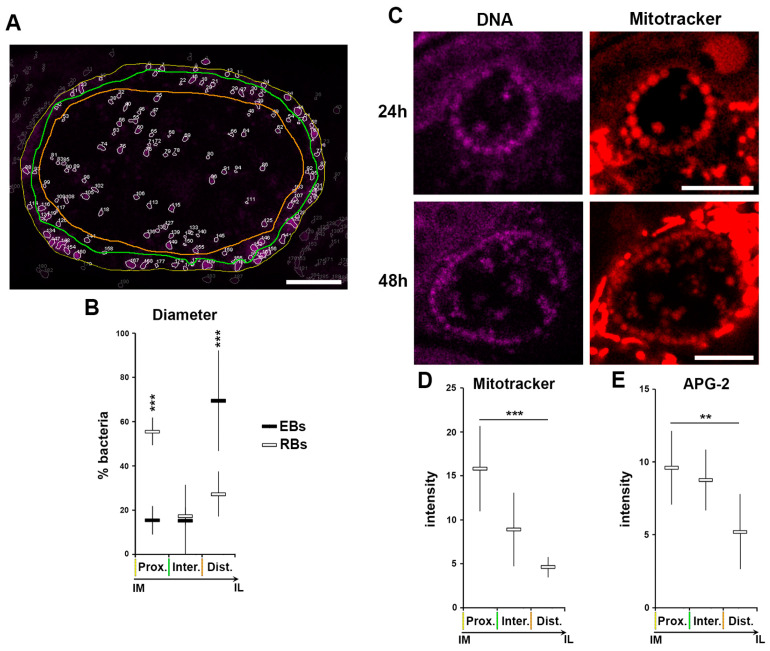
Prokaryotic communities coordinate quorum behaviour in response to external stimuli to control fundamental processes including inter-bacterial communication. The obligate intracellular bacterial pathogen Chlamydia adopts two developmental forms, invasive elementary bodies (EBs) and replicative reticulate bodies (RBs), which reside within a specialised membrane-bound compartment within the host cell termed an inclusion. The mechanisms by which this bacterial community orchestrates different stages of development from within the inclusion in coordination with the host remain elusive. Both prokaryotic and eukaryotic kingdoms exploit ion-based electrical signalling for fast intercellular communication. Here we demonstrate that RBs specifically accumulate potassium (K+) ions, generating a gradient. Disruption of this gradient using ionophores or an ion-channel inhibitor stalls the Chlamydia lifecycle, inducing persistence. Using photobleaching approaches, we establish that the RB is the master regulator of this [K+] differential and observe a fast K+ exchange between RBs revealing a role for this ion in inter-bacterial communication. Finally, we demonstrate spatio-temporal regulation of bacterial membrane potential during RB to EB differentiation within the inclusion. Together, our data reveal that Chlamydia harnesses K+ to orchestrate host sensing, inter-bacteria communication and pathogen differentiation.

Keywords: Chlamydia; cell-to-cell communications and community; host-pathogen interactions.


Conflict of interest statement

The authors declare no conflict of interest.

Figures

Figure 1
Figure 1
Asante potassium green 2 (APG-2), a valid tool to study K+ by live cell imaging. (A) Provided by supplier (with permission), variation of APG-2 intensity depending on the K+ concentration (different coloured lines). (B) HeLa cells were labelled with APG-2 and imaged using confocal microscopy. Scale bar: 25 µm (C) Measured average cytoplasmic APG-2 intensity of non-infected non-treated cells were classified according the x-axis. (D) HeLa cells were treated with nigericin (green), valinomycin (red) or untreated (blue). Following this, 6 h later, [K+] was determined flame photometry as indicated (Materials and Methods and Figure S1A) and normalised to the control. (E) HeLa cells were labelled with APG-2 and imaged using confocal microscope every 5 min for 40 min. (F) HeLa cells were treated with glibenclamide 12 h prior to labelling with APG-2 followed by confocal imaging. Scale bar: 25 µm. (G) Class average intensity of APG-2 performed as in (C) in glibenclamide treated cells as represented in (F). (H) Non-treated HeLa cells as in (B) or HeLa cells treated with glibenclamide as in (F) were subjected to photobleaching of a portion of their cytoplasm as presented in the upper panels. Analysis of the APG-2 fluorescence intensity (lower panel) over time was performed for the different conditions: control cells are represented in two shades of green (dark: high intensity or bright: low intensity) and glibenclamide-treated cells are represented by two shades of orange (dark: high intensity or bright: low intensity). High intensity: from categories 4–6 and beyond as in (C) and (G). Low intensity: categories 0–1 and 1–3 as in (C) and (G).
Figure 2
Figure 2
C. trachomatis RBs accumulate K+. HeLa cells were infected with C. trachomatis LGV2. (A) Infected cells were incubated with APG-2 24 hpi and a mixed population of infected and non-infected cells imaged. Cell edges are indicated in blue for non-infected cells (NI) and in red for infected cells (I). Scale bar: 10 µm. (B) Measured average cytoplasmic APG-2 intensity of non-infected cells were classified according the x-axis. (C) Infected cells at 12, 24 and 36 hours post infection (hpi) were incubated with APG-2 and imaged. Scale bar: 10 µm. (D) Upper panel: schematic of the experiment design. I: infection. Lower panel: Infectivity assay of cells collected at the indicated time on the x-axis corresponding to the collection time on the upper panel. The y-axis shows the inclusion forming unit per mL (IFU/mL). The different phases of infection corresponding to the infectivity assay are indicated. Error bars: standard deviation. (EH) cells were infected with C. trachomatis LGV2 as in (A) to (D), but bacteria were transformed with pASK-GFP-L2 allowing the expression of mKate (red) only when the bacteria are in the RB form. Cells were incubated with APG-2 at the indicated time point ((E,F) 12 hpi; (G,H) 48 hpi) and imaged. Image analyses were performed as described (Experimental Procedures and Figure S1B) allowing the measurement of the bacterial diameter, the intensity of APG-2 (green) and mKate (red) for each individual bacteria ((F) and (H), grey level reflecting different type form of the bacteria).
Figure 3
Figure 3
Effect of K+ ionophores on chlamydial infectivity and morphology. HeLa cells were infected with C. trachomatis LGV2. (A) Schematic of the experiment design associated with panel B. I: infection. Time of treatment, corresponding to the different phases of the Chlamydia lifecycle as indicated, and collection have been determined based on the titration assay (Figure 2D). (B) Infected cells were treated with nigericin (white bars) or untreated (black bars) at the indicated phase of the lifecycle (x-axis) and samples collected at 50 hpi. Infectivity was assessed and IFU/mL indicated on the y-axis. ** p < 0.01, *** p < 0.005. Error bars: standard deviation. For (CE) cells were treated as indicated at 12 hpi and fixed at 24 hpi prior to labelling with anti-Chlamydia (green) and DNA probe (magenta). Scale bar: 5 µm. (C) upper panels: non-treated, lower panels: doxycycline (D) upper panels: IFN-γ lower panels: adenosine (Ad/EHNA) (E) upper panels: nigericin, lower panels: valinomycin. (F,G) control infected cells (F) or treated at 12 hpi with nigericin (G) prior to processing for transmission electron microscopy at 24 hpi. Scale bar: 2 µm.
Figure 4
Figure 4
Interfering with cytoplasmic [K+] leads to Chlamydia persistence. HeLa cells were infected with C. trachomatis LGV2. (A) Cells were treated with glibenclamide 12 hpi prior to fixation at 24 hpi followed by labelling with anti-Chlamydia (green) and DNA probe (DRAQ-5, magenta). Insert shows a normal inclusion (*) and abnormal inclusion (+) at higher magnification. Scale bar: 25 µm. (B) upper panel: schematic of the experiment design. I: infection. Lower panel: after treatment with glibenclamide and sample collection as described in the upper panel, lysate were tested for infectivity by measuring inclusion forming units per mL (IFU/mL). (C) Upper panel: schematic of the experiment design. I: infection. Lower panel: reversion of persistence assay, performed as described in the upper panel. Infectivity assays were performed (IFU/mL: inclusion forming unit per mL). For (B) and (C), error bars: standard deviation. (D) At 12 hpi, cells were treated with 1 µM nigericin, valinomycin or doxycycline. At 50 hpi, cells were prepared for RNA expression analysis by RT-PCR using 18S as a loading control and 16S as a marker of bacterial viability.
Figure 5
Figure 5
Critical importance of the interface between the bacteria and host cytosol. HeLa cells were infected with C. trachomatis LGV2. At 12 hpi cells were treated IFN-γ, Ad/EHNA (adenosine) or nigericin and incubated for a further 12 h. At 24 hpi, cells were incubated with APG-2 and DNA probe (DRAQ-5, magenta) and imaged using confocal microscopy (left panels). Scale bars: 5 µm. Image analyses allowed the comparison of the average APG-2 intensity in the cytoplasm (cyto), reticulate bodies (RB) and inclusion lumen (IL), and a ratio determined (right panels). Black column: non-treated, white column: treated. Error bars: standard deviation. * p < 0.05, ** p < 0.01, *** p < 0.005.
Figure 6
Figure 6
Fast movement of K+ between the host cytoplasm and the inclusion. HeLa cells were infected with C. trachomatis LGV2. At 24 hpi cells were labelled with APG-2 and then imaged. APG-2 was bleached in the cytoplasm (A) or the inclusion (B), and imaged again using confocal microscopy, as represented in the upper panel where one cell is shown as a representative example. Circles represent regions of interest: inclusion (blue) and cytoplasm (red). Scale bar: 5 µm. On the lower panel, analysis of fluorescence intensities of the inclusion of cytoplasm are represented related to the frame number (a frame per 1.509 s). The light grey boxes represent the bleaching step. (C) Schematic of the result, the cell is depicted, and the cytoplasm is coloured in red while the inclusion is in blue. The green arrows represent the proposed K+ movement.
Figure 7
Figure 7
K+ flux is controlled by the reticulate body. (A,B) HeLa cells were infected with C. trachomatis LGV2. At 24 hpi cells were labelled with APG-2 and DRAQ-5 and then imaged. APG-2 was photobleached as indicated on the upper panels in the cytoplasm (A) or in the whole inclusion (B). Circles show the regions of interest used for the analysis of the intensity depending on the frame (lower panels: 1.509 s/frame) presented on the lower panels. Dark blue: reticulate bodies (RBs) and light blue for the inclusion lumen. Scale bar: 5 µm. (C) schematics showing the proposed K+ flux (pink arrows) between the host cytoplasm (white) the inclusion lumen (light blue) and the bacteria (dark blue). (D) HeLa cells were infected with C. trachomatis LGV2. At 24 hpi cells were labelled with APG-2 and DRAQ-5 and then imaged. APG-2 was photobleached in the inclusion lumen. (E) schematics showing the proposed K+ flux (pink arrows) between the host cytoplasm (white) the inclusion lumen (light blue) and the bacteria (dark blue).
Figure 8
Figure 8
K+ is exchanged between reticulate bodies. (A) HeLa cells were infected with C. trachomatis LGV2. At 24 hpi cells were labelled with APG-2 and DRAQ-5 and then imaged. APG-2 was photobleached as indicated on the upper panels in some reticulate bodies (RBs). Circles show the region of interest used for the analysis of the intensity depending on the frame (lower panels: 1.509 s/frame) presented on the lower panels. Dark blue: unbleached RBs and light blue: bleached RBs. Scale bar: 5 µm. (B) Shows schematics of the proposed K+ flux (pink arrows), between the host cytoplasm (white) the inclusion lumen (light blue) and the bacteria (dark blue).
Figure 9
Figure 9
Loss of K+ is associated to loss in membrane potential during RB to EB differentiation. HeLa cells were infected with C. trachomatis LGV2. All measurements have been performed on inclusions at 48 hpi. (A) An example of the segmentation experiments. The edge of the inclusion is highlighted with a yellow line, the region where the bacteria are in close proximity to the inclusion edge is outlined in green, and the luminal space of the inclusion by an orange line. Scale bar: 5 µm. (B) Bacterial diameter has been determined and a threshold applied to differentiate the elementary bodies (EBs), reticulate bodies (RBs) and intermediate bodies (IBs) (Figure 2E–H). The relative number (as a percentage) of each bacterial form is plotted against the position in the inclusion following the parameters established in previous panel (Prox.: directly proximal to the inclusion membrane, Inter: intermediate space, Dist.: distal to the inclusion membrane (luminal space). Coloured lines mirror those shown in previous panel. ***: p < 0.001. (C) At the indicated time point cells were incubated with Mitotracker and DNA probe (DRAQ-5) prior to imaging. Scale bar: 5 µm. (D) Mitotracker intensity was determined for RBs in different regions of the inclusion defined in the previous panels (A and B) ***: p < 0.001. (E) APG-2 intensity was determined for RBs position in different regions of the inclusion as in previous panel (A and B) **: p < 0.1, ***: p < 0.01.

Similar articles

Cited by

References

    1. Eley A. Chlamydia trachomatis is bad for your sperm! Microbiol. Today. 2003;30:61–62.
    1. Hogan R.J., Mathews S.A., Mukhopadhyay S., Summersgill J.T., Timms P. Chlamydial Persistence: Beyond the Biphasic Paradigm. Infect. Immun. 2004;72:1843–1855. doi: 10.1128/IAI.72.4.1843-1855.2004. - DOI - PMC - PubMed
    1. Mpiga P., Ravaoarinoro M. Chlamydia trachomatis persistence: An update. Microbiol. Res. 2006;161:9–19. doi: 10.1016/j.micres.2005.04.004. - DOI - PubMed
    1. Skowasch D., Yeghiazaryan K., Schrempf S., Golubnitschaja O., Welsch U., Preusse C.J., A Likungu J., Welz A., Lüderitz B., Bauriedel G. Persistence of Chlamydia pneumoniae in degenerative aortic valve stenosis indicated by heat shock protein 60 homologues. J. Heart Valve Dis. 2003;12:68–75. - PubMed
    1. Borel N., Summersgill J.T., Mukhopadhyay S., Miller R.D., Ramirez J.A., Pospischil A. Evidence for persistent Chlamydia pneumoniae infection of human coronary. Atherosclerosis. 2008;199:154–161. doi: 10.1016/j.atherosclerosis.2007.09.026. - DOI - PubMed

LinkOut - more resources