. 2021 Jan 15;22(2):810.
doi: 10.3390/ijms22020810.

Optogenetic Stimulation of Prelimbic Pyramidal Neurons Maintains Fear Memories and Modulates Amygdala Pyramidal Neuron Transcriptome

Affiliations

Optogenetic Stimulation of Prelimbic Pyramidal Neurons Maintains Fear Memories and Modulates Amygdala Pyramidal Neuron Transcriptome

Daniela Laricchiuta et al. Int J Mol Sci. .

Abstract

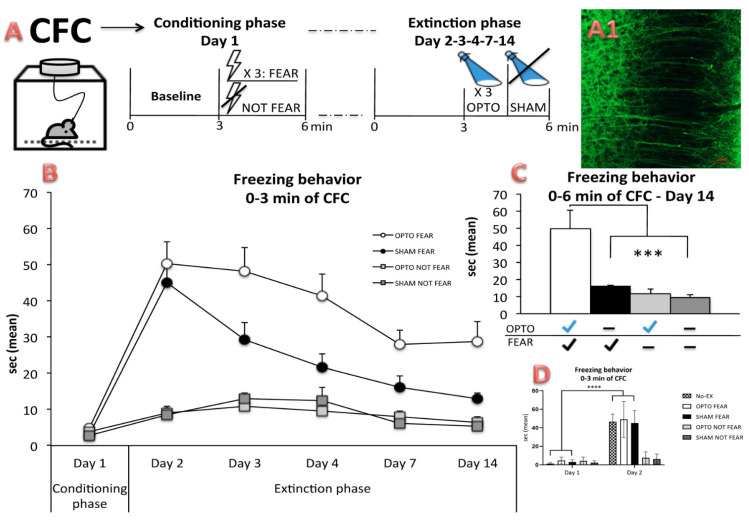
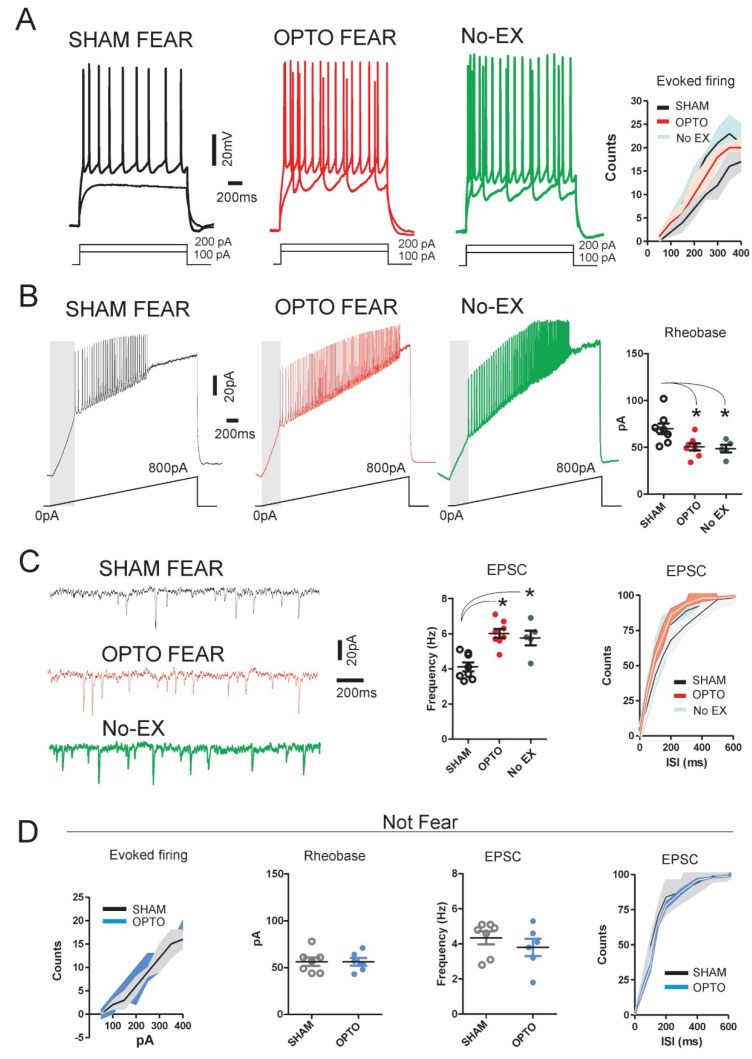
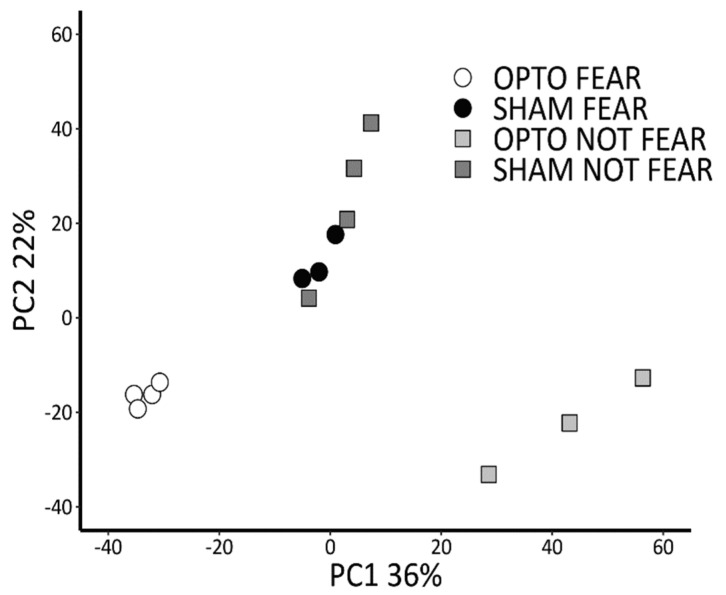
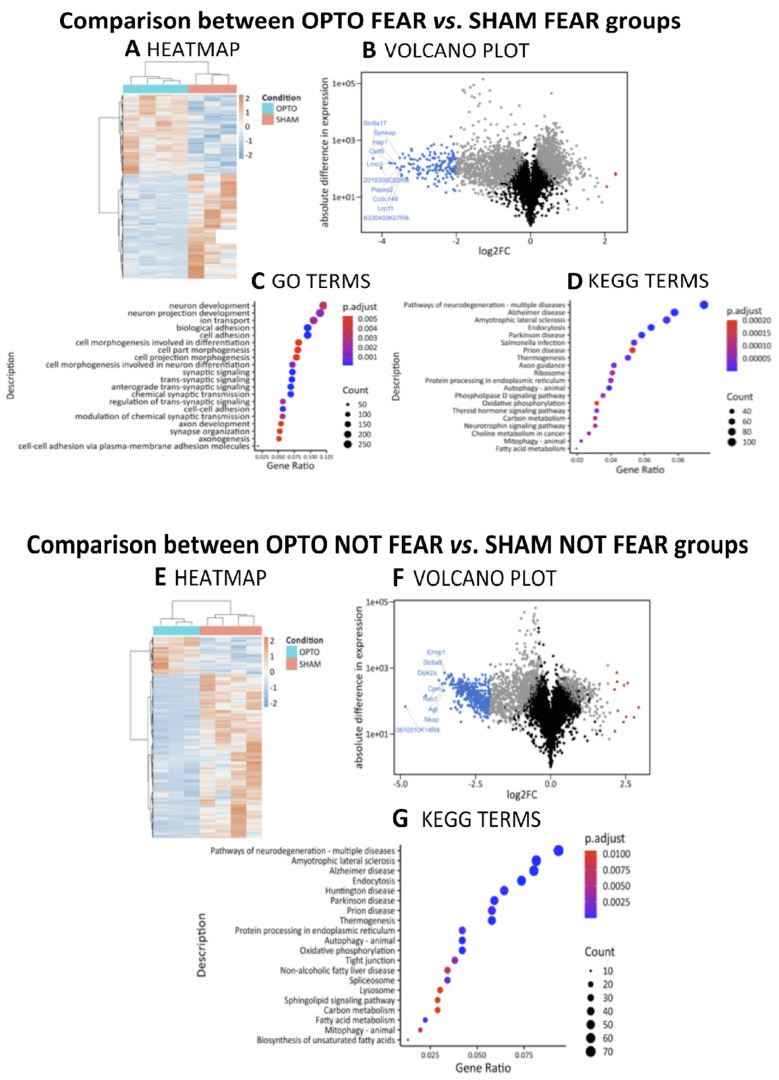
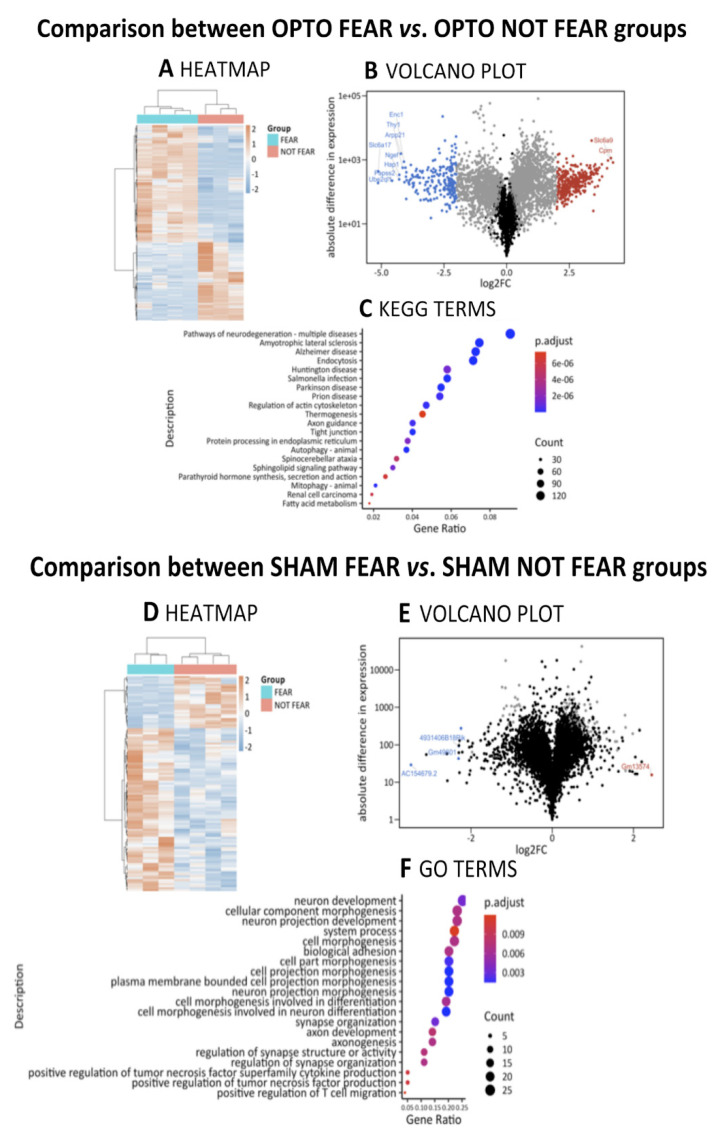
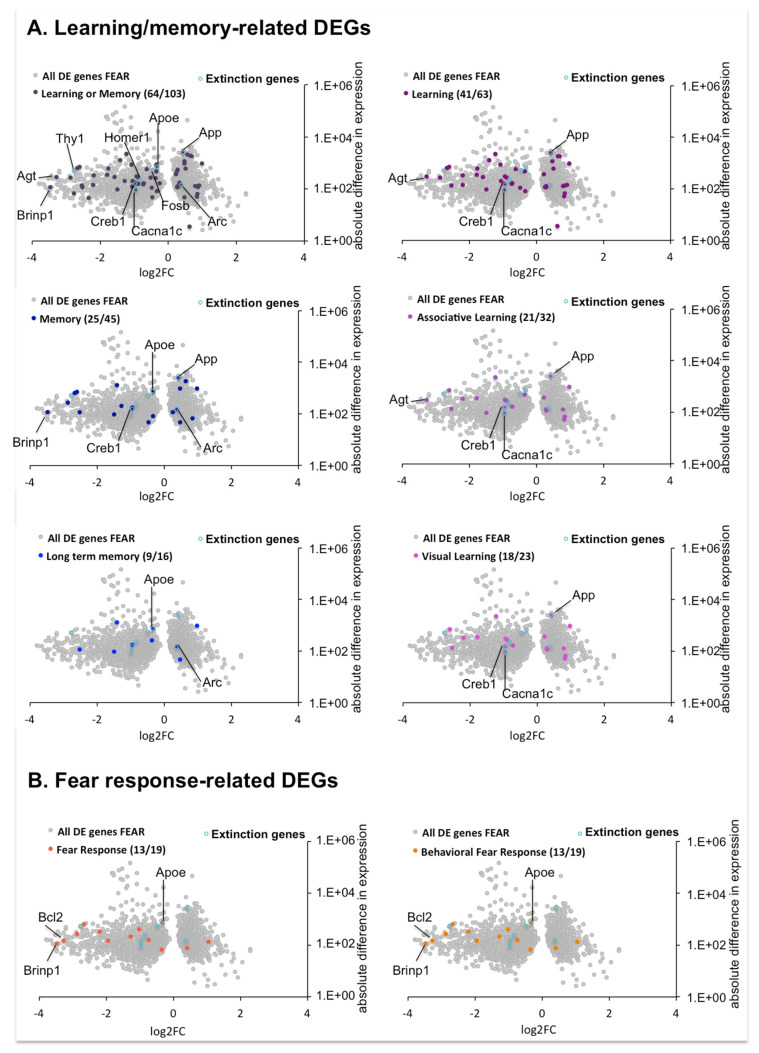
Fear extinction requires coordinated neural activity within the amygdala and medial prefrontal cortex (mPFC). Any behavior has a transcriptomic signature that is modified by environmental experiences, and specific genes are involved in functional plasticity and synaptic wiring during fear extinction. Here, we investigated the effects of optogenetic manipulations of prelimbic (PrL) pyramidal neurons and amygdala gene expression to analyze the specific transcriptional pathways associated to adaptive and maladaptive fear extinction. To this aim, transgenic mice were (or not) fear-conditioned and during the extinction phase they received optogenetic (or sham) stimulations over photo-activable PrL pyramidal neurons. At the end of behavioral testing, electrophysiological (neural cellular excitability and Excitatory Post-Synaptic Currents) and morphological (spinogenesis) correlates were evaluated in the PrL pyramidal neurons. Furthermore, transcriptomic cell-specific RNA-analyses (differential gene expression profiling and functional enrichment analyses) were performed in amygdala pyramidal neurons. Our results show that the optogenetic activation of PrL pyramidal neurons in fear-conditioned mice induces fear extinction deficits, reflected in an increase of cellular excitability, excitatory neurotransmission, and spinogenesis of PrL pyramidal neurons, and associated to strong modifications of the transcriptome of amygdala pyramidal neurons. Understanding the electrophysiological, morphological, and transcriptomic architecture of fear extinction may facilitate the comprehension of fear-related disorders.

Keywords: RNA sequencing; differential gene expression; electrophysiological recordings; excitatory post-synaptic currents; fear conditioning; fear extinction; fear-related disorders; medial prefrontal cortex; spinogenesis.


Conflict of interest statement

The authors declare no conflict of interest.

Figures

Figure 1
Figure 1
Experimental procedures and behavioral results of in vivo optogenetics of the Prelimbic (PrL) pyramidal neurons during Contextual Fear Conditioning (CFC). (A) On day 1 (Conditioning phase) of CFC, each Thy1-COP4 mouse was allowed to explore the conditioning chamber for 3 min (Baseline). Afterward, only a part of the entire sample received three foot-shocks. On days 2, 3, 4, 7, and 14 (Extinction phase), the fear-conditioned (n = 20) and not fear-conditioned (n = 20) mice were placed again in the conditioning chamber for 6 min. During the Extinction phase, no shock was delivered and the mice received three optogenetic (OPTO FEAR and OPTO NOT FEAR groups, n = 10/group) or sham (SHAM FEAR and SHAM NOT FEAR groups, n = 10/group) stimulations of PrL pyramidal neurons. To control for the effects of learned but not yet extinguished fear, on day 1 (Conditioning phase) of CFC other Thy1-COP4 mice (No-EX group, n = 6) were allowed to explore the conditioning chamber for 3 min (Baseline) and then they received three foot-shocks. The day after the Conditioning phase (day 2) these animals were placed again in the conditioning chamber for 6 min (without receiving any optogenetic stimulation) and then sacrificed for electrophysiological and morphological analyses. A1) Representative image of the expression of the transgenic ChR2-YFP fusion protein detected in pyramidal cortical layer 5 neurons of PrL cortex. Scale bar 50 μm. (B) Freezing behavior measured during 0–3 min of CFC. The animals belonging to OPTO FEAR, OPTO NOT FEAR, SHAM FEAR, and SHAM NOT FEAR groups showed similar responses in the Conditioning phase and only the fear-conditioned animals (OPTO FEAR and SHAM FEAR groups) showed increased freezing times on day 2. While SHAM FEAR group progressively extinguished fear memories over time, impaired extinction of fear memories was observed in OPTO FEAR group. (C) Freezing times measured during 0–6 min of day 14. OPTO FEAR group showed the highest freezing times in comparison to the remaining groups (*** p = 0.0005). (D) Freezing behavior measured during 0–3 min of day 1 and 2 of CFC. Only the fear-conditioned animals (No-EX, OPTO FEAR, and SHAM FEAR groups) increased their freezing times between day 1 and day 2 (**** p < 0.0001), showing similar consolidation of fear memory. Data are reported as mean ± SEM.
Figure 2
Figure 2
Modulation of cellular excitability of Prelimbic (PrL) pyramidal neurons by optogenetic stimulation. (A) Representative traces in current-clamp configuration reporting evoked firing activity triggered by a series of depolarizing current steps (0 to 400 pA) applied to PrL pyramidal neurons of SHAM FEAR (black, n = 8 neurons from 5 mice), OPTO FEAR (red, n = 8 neurons from 5 mice), and No-EX (green, n = 5 neurons from 3 mice) groups. The cumulative plot shows the changes in firing activity. (B) Representative traces of PrL pyramidal neurons of SHAM FEAR (black, n = 8 neurons from 5 mice), OPTO FEAR (red, n = 8 neurons from 5 mice), and No-EX (green, n = 5 neurons from 3 mice) groups showing the firing activity triggered by linear depolarization from 0 to 800 pA. Graph (on the right) reports the effects of optogenetic stimulation on rheobase value. Namely, PrL pyramidal neurons of OPTO FEAR and No-EX groups recorded after optogenetic stimulation showed a clear reduction in the rheobase value in comparison to neurons of SHAM FEAR group (* at least p = 0.01). (C) Representative traces of Excitatory Post-Synaptic Currents (EPSC) of PrL pyramidal neurons of SHAM FEAR (black, n = 8 neurons from 5 mice), OPTO FEAR (red, n = 8 neurons from 5 mice), and No-EX (green, n = 5 neurons from 3 mice) groups. Graph plot (in the middle) and cumulative curve (on the right) depict the clear increase in firing frequency in PrL pyramidal neurons of OPTO FEAR and No-EX groups (* at least p = 0.01). (D) Graphs and cumulative curves report no significant differences in cellular excitability in PrL pyramidal neurons of SHAM NOT FEAR (black) and OPTO NOT FEAR (blue) groups. Data are reported as median with interquartile range.
Figure 3
Figure 3
Spine counting of the apical arborizations of Prelimbic pyramidal neurons. No-EX group, encompassing animals submitted to fear learning but not to fear extinction (sacrificed at Day 2), had the highest number (A) and density (B) of dendritic spines in comparison to OPTO FEAR, OPTO NOT FEAR, SHAM FEAR, and SHAM NOT FEAR groups (**** at least p = 0.0001). The OPTO FEAR group showed higher spine number (A) and density (B) in comparison to the other groups (°°° at least p = 0.0001) that, in turn, exhibited similar spinogenesis. Data are reported as mean ± SEM.
Figure 4
Figure 4
Principal Component Analysis revealing sample clustering based on gene expression profiles. While gene expression profile of mice belonging to SHAM FEAR and SHAM NOT FEAR groups appeared clustered, those of individuals belonging to OPTO FEAR and OPTO NOT FEAR groups were markedly segregated.
Figure 5
Figure 5
Differential Gene Expression profiling and functional enrichment analysis of RNA extracted by amygdala pyramidal neurons. Comparisons between OPTO FEAR vs. SHAM FEAR groups (upper part) and OPTO NOT FEAR vs. SHAM NOT FEAR groups (lower part). (A,E) Heatmaps showing gene expression values for the Differentially Expressed Genes (DEGs). (B,F) Volcano plots highlighting DEGs. The x-axis is the log2 fold change (log2FC) in normalized gene expression and the y-axis is for the log10 absolute value of the difference in expression between conditions. Each dot represents a gene. Grey dots are for DEGs, blue and red dots are for <−2 and >+2 log2FC genes, respectively. The top ten genes with the highest absolute log2FC values are labeled. (C,D,G) Dot plots representing the top twenty enriched terms from over-representation analyses (ORA) in Gene Ontology (GO) and Kyoto Encyclopedia of Genes and Genomes (KEGG) databases. GO terms from different domains (Biological Processes, Cellular Component, and Molecular Function) were sorted by q-value before plotting them together.
Figure 6
Figure 6
Differential Gene Expression profiling and functional enrichment analysis of RNA extracted by amygdala pyramidal neurons. Comparisons between OPTO FEAR vs. OPTO NOT FEAR groups (upper part) and SHAM FEAR vs. SHAM NOT FEAR groups (lower part). (A,D) Heatmaps showing gene expression values for the Differentially Expressed Genes (DEGs). (B,E) Volcano plots highlighting DEGs. The x-axis is the log2 fold change (log2FC) in normalized gene expression and the y-axis is for the log10 absolute value of the difference in expression between conditions. Each dot represents a gene. Grey dots are for DEGs, blue and red dots are for <−2 and > + 2 log2FC genes, respectively. The top ten genes with the highest absolute log2FC values are labeled. (C,F) Dot plots representing the top twenty enriched terms from over-representation analyses (ORA) in Gene Ontology (GO) and Kyoto Encyclopedia of Genes and Genomes (KEGG) databases. GO terms from different domains (Biological Processes, Cellular Component, and Molecular Function) were sorted by q-value before plotting them together.
Figure 7
Figure 7
Differentially Expressed Genes (DEGs) with Gene Ontology annotations associated to Learning/memory and Fear response, between OPTO FEAR vs. SHAM FEAR groups. DEGs for each indicated Biological Process (BP) are highlighted as colored dots on the volcano plot representing the total DEGs between OPTO FEAR vs. SHAM FEAR groups, indicated by grey dots. Numbers into brackets indicate the number of DEGs related to each indicated BP over the gene universe. Light blue dots indicate genes described in literature as associated to fear extinction. When DEGs are part of the top twenty DEGs list and/or part of the considered BP the gene name is indicated.
Figure 8
Figure 8
Gating strategy for amygdala pyramidal neurons cell purification. Amygdala pyramidal neurons, excited with a ~488 nm blue laser, were sorted on the basis of their physical parameters (forward scatter, FSC, and side scatter, SSC, light scattering) (A), singlets (B), propidium iodide negative (live cells) (C) and Yellow Fluorescent Protein (YFP) intensity (D), and the positive cells were collected. Cells are sorted by high-speed cell sorting (Moflo Astrios EQ).

Similar articles

Cited by

References

    1. Maren S., Fanselow M.S. The Amygdala and Fear Conditioning: Has the Nut Been Cracked? Neuron. 1996;16:237–240. - PubMed
    1. Davis M. The Role of the Amygdala in Conditioned and Unconditioned Fear and Anxiety. Amygdala. 2000;2:213–287.
    1. LeDoux J.E. Emotion Circuits in the Brain. Annu. Rev. Neurosci. 2000;23:155–184. - PubMed
    1. Fanselow M.S., Gale G.D. The Amygdala, Fear, and Memory. Ann. N. Y. Acad. Sci. 2003;985:125–134. - PubMed
    1. Holmes A., Singewald N. Individual Differences in Recovery from Traumatic Fear. Trends Neurosci. 2013;36:23–31. - PMC - PubMed

MeSH terms