Review
. 2021 Jan 15;11(1):216.
doi: 10.3390/nano11010216.

A Review of Graphene-Based Surface Plasmon Resonance and Surface-Enhanced Raman Scattering Biosensors: Current Status and Future Prospects

Affiliations
Review

A Review of Graphene-Based Surface Plasmon Resonance and Surface-Enhanced Raman Scattering Biosensors: Current Status and Future Prospects

Devi Taufiq Nurrohman et al. Nanomaterials (Basel). .

Abstract

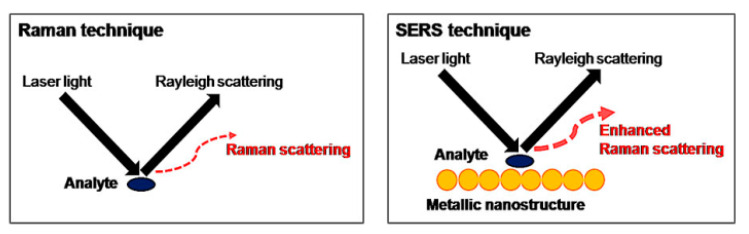
The surface plasmon resonance (SPR) biosensor has become a powerful analytical tool for investigating biomolecular interactions. There are several methods to excite surface plasmon, such as coupling with prisms, fiber optics, grating, nanoparticles, etc. The challenge in developing this type of biosensor is to increase its sensitivity. In relation to this, graphene is one of the materials that is widely studied because of its unique properties. In several studies, this material has been proven theoretically and experimentally to increase the sensitivity of SPR. This paper discusses the current development of a graphene-based SPR biosensor for various excitation methods. The discussion begins with a discussion regarding the properties of graphene in general and its use in biosensors. Simulation and experimental results of several excitation methods are presented. Furthermore, the discussion regarding the SPR biosensor is expanded by providing a review regarding graphene-based Surface-Enhanced Raman Scattering (SERS) biosensor to provide an overview of the development of materials in the biosensor in the future.

Keywords: biosensors; graphene; surface plasmon resonance.


Conflict of interest statement

The authors declare no conflict of interest.

Figures

Figure 1
Figure 1
Graphene and its derivatives.
Figure 2
Figure 2
Configurations of the attenuated total reflection (ATR) method: (a) Otto configuration and (b) Kretschmann configuration. (c) The dispersion curve for a surface plasmon mode shows the momentum mismatch problem between the free space photon (kphoton, gree line) and surface plasmon modes (kSP, red line). (d) Dispersion relation of surface plasmon with photon. (e) The same effect of momentum-supply can be achieved by corrugating the metallic surface in the so-called prism-coupled SPR. The resonance is by using evanescent wave produced in attenuated total reflection (ATR).
Figure 3
Figure 3
The SPR structure investigated by: (a) Wu et al. (left) and (b) Choi et al. (right) (adapted with permission from References [31,32] © The Optical Society).
Figure 4
Figure 4
The SPR structure investigated by (a) Maharana et al. (left) and (b) Verma et al. (right) (adapted with permission from References [33,34], copyright Elsevier).
Figure 5
Figure 5
Reflectance and sensitivity on standard and long-range surface plasmon resonance (LRSPR) structure for (a) Al+graphene, (b) Cu+graphene, and (c) Ag+graphene (adapted with permission from Reference [37], copyright IEEE).
Figure 6
Figure 6
(a) Experimental scheme of the SPR biosensor integrated with loop-mediated isothermal amplification (LAMP) for detection of tuberculosis bacterial DNA (TB DNA). (b) SPR response on Cys-GO, Cys-rGO, and Cys-linker sensing surface (adapted with permission from Reference [38], copyright SPIE).
Figure 7
Figure 7
(a) GOS based SPR structure. (b) The response of the SPR biosensor at different anti-BSA concentrations (adapted with permission from Reference [40], copyright Springer Nature).
Figure 8
Figure 8
(a) Carboxyl-functionalized graphene oxide (GO)-based SPR structure as immunosensor to detect CK19. (b) Response of SPR biosensor at different CK19 concentrations and their linear ranges (adapted with permission from Reference [41], copyright Elsevier).
Figure 9
Figure 9
(a) SPR response at different FAP concentrations from 10 fM to 1 µm. (b) Repeatability of FAP detection for 20 days using the same sensor (adapted with permission from Reference [43], copyright Elsevier).
Figure 10
Figure 10
(a) Calibration curve or SPR angle shift at different DENV 2 E-Protein concentrations, (b) The response of the SPR chip to different antigens (DENV 2 E-Protein, DENV E-protein, and ZIKV E-protein) (adapted with permission from Reference [44], copyright MDPI).
Figure 11
Figure 11
(a) Experimental scheme of the SPR biosensor coupled with fiber optic. (b) SPR spectrum at the refractive index of 1.33, 1.35, and 1.37 (top: without graphene, bottom: with graphene) (adapted with permission from Reference [57], copyright IEEE).
Figure 12
Figure 12
(a) Schematic diagram of an end reflection optical fiber with graphene. (b) SPR reflectance and sensitivity spectra were generated in structures without (left) and with graphene (right) (adapted with permission from Reference [58], copyright Elsevier).
Figure 13
Figure 13
The SPR reflection spectrum at different concentrations of NaCl solution on sensing probes: (a) without graphene and (b) with graphene (adapted with permission from Reference [58], copyright Elsevier).
Figure 14
Figure 14
(a) Schematic of the designed Ag–Graphene coated photonic crystal fiber (PCF)–SPR sensor. (b) The relationship between the resonant wavelength and the analyte’s refractive index varies from 1.33 to 1.41 (adapted with permission from Reference [59], copyright MDPI).
Figure 15
Figure 15
(a) SPR probe fabrication process. (b) SPR transmittance spectrum at different temperatures from 40 °C to 110 °C. (c) SPR response and fitting curve after heating and cooling process (adapted with permission from Reference [61], copyright IEEE).
Figure 16
Figure 16
Schematic diagram of the grating-based SPR biosensor (adapted with permission from Reference [73], copyright MDPI).
Figure 17
Figure 17
(a) A schematic diagram of graphene–gold grating. (b) The intensity distribution of the electromagnetic field at maximum wavelength of SPR mode. (c) SPR sensitivity investigations based on the shift in peak wavelength on the extinction curve (adapted with permission from Reference [74], copyright Elsevier).
Figure 18
Figure 18
(a) Schematic of the conformal graphene-decorated nanofluidic channel (CGDNC) infrared sensor. (b) Investigation of sensor sensitivity based on data on the transmittance spectrum (adapted with permission from Reference [77], copyright MDPI).
Figure 19
Figure 19
(a) Sketch of the developed SPR biosensor and SEM image results. (b) The response of the biosensor with bare gold and graphene coated gold after exposure to ethanol (Reproduced from [79], with the permission of AIP Publishing).
Figure 20
Figure 20
(a) Longitudinal section of the graphene-based long period fiber grating (LPFG) SPR sensor. (b) Resonance wavelength shift versus concentration of methane (adapted with permission from Reference [80], copyright MDPI).
Figure 21
Figure 21
(a) SPR response at three different nanoparticles (Au film, Au-Gra, Ag-Gra). (b) The selectivity of the SPR on three different analytes (human IgG, bovine IgG, and mouse IgG) (adapted with permission from Reference [84], copyright Elsevier).
Figure 22
Figure 22
(a) The relationship between optical absorbance and wavelength at different anti BSA concentrations (145 fM-1.45 nM). (b) Calibration curves obtained from shifts in absorbance peaks (A and B) due to detection of anti-BSA with different concentrations (adapted with permission from Reference [85], copyright Springer Nature).
Figure 23
Figure 23
The excitation and emission of surface plasmon coupled emission (SPCE) in (a) Kretschmann (KR) configuration, (b) reverse Kretschmann (RK) configuration (adapted with permission from Reference [93], copyright Elsevier).
Figure 24
Figure 24
(a) Schematic depicting the graphene–fluorophore (π–π stacking) and graphene–silver (plasmon–plasmon coupling) interactions. (b) Enhancement plot displaying intensity of the SPCE of the different Ag–graphene (Single layer graphene (SLG), bilayer graphene (BLG), few layered graphene (FLG), and exfoliated graphene (EG)) versus the intensity of the free space emission (adapted with permission from Reference [94], copyright American Chemical Society).
Figure 25
Figure 25
(a) AgNCs and GO enhanced SPCE structure. (b) The resulting fluorescence spectrum (right) (adapted with permission from Reference [95], copyright Elsevier).
Figure 26
Figure 26
Dependences of the fluorescence intensities of (a) SPCE (Au+GO) and (b) SPCE (Au) on the concentration of human IgG (adapted with permission from Reference [96], copyright Elsevier).
Figure 27
Figure 27
The principles behind Raman and Surface-Enhanced Raman Scattering (SERS) techniques (adapted with permission from Reference [107], copyright Institute of Food Technologists).
Figure 28
Figure 28
(a) Schematic illustration of graphene as a substrate for suppressing the photoluminescence of R6G. (b) Raman spectrum of R6G in water (blue line) and R6G in single layer graphene (red line). (c) Raman spectra of R6G on SiO2/Si and graphene substrate, respectively (adapted with permission from References [109,110], copyright American Chemical Society).
Figure 29
Figure 29
(a) Illustration of detection of DNA targets with Ag NPs-Ag NPs-GO. (b) The SERS spectrum was obtained at different complement DNA target concentrations (Reproduced from Reference [113] with permission from the PCCP Owner Societies).

Similar articles

Cited by

References

    1. Li Z., Zhang W., Xing F. Graphene Optical Biosensors. Int. J. Mol. Sci. 2019;20:2461. doi: 10.3390/ijms20102461. - DOI - PMC - PubMed
    1. Papageorgiou D.G., Kinloch I.A., Young R.J. Graphene/elastomer nanocomposites. Carbon. 2015;95:460–484. doi: 10.1016/j.carbon.2015.08.055. - DOI
    1. Liu J., Cui L., Losic D. Graphene and graphene oxide as new nanocarriers for drug delivery applications. Acta Biomater. 2013;9:9243–9257. doi: 10.1016/j.actbio.2013.08.016. - DOI - PubMed
    1. Bai L., Zhang Y., Tong W., Sun L., Huang H., An Q., Tian N., Chu P.K. Graphene for Energy Storage and Conversion: Synthesis and Interdisciplinary Applications. Electrochem. Energy Rev. 2020;3:395–430. doi: 10.1007/s41918-019-00042-6. - DOI
    1. Lin J., Huang Y., Huang P. Biomedical Applications of Functionalized Nanomaterials. Elsevier; Amsterdam, The Netherlands: 2018. Graphene-Based Nanomaterials in Bioimaging; pp. 247–287.

LinkOut - more resources