

Application of Machine-Learning Methods to Recognize mitoBK Channels from Different Cell Types Based on the Experimental Patch-Clamp Results
- PMID: 33467711
- PMCID: PMC7831025
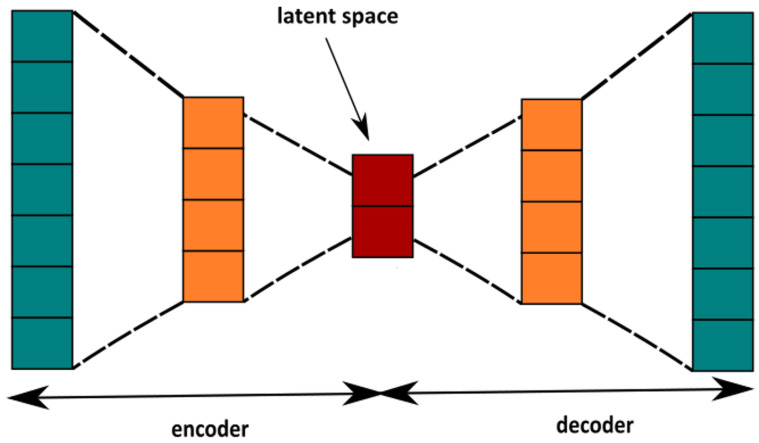
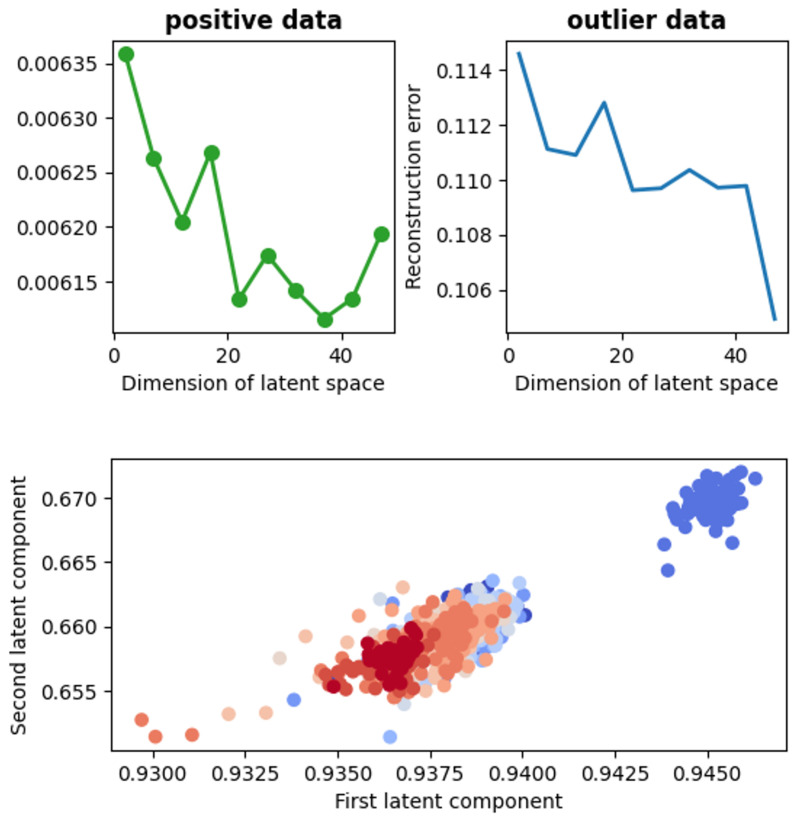
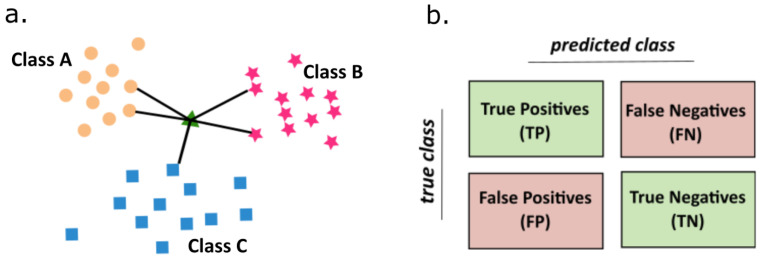
- DOI: 10.3390/ijms22020840
Application of Machine-Learning Methods to Recognize mitoBK Channels from Different Cell Types Based on the Experimental Patch-Clamp Results
Abstract
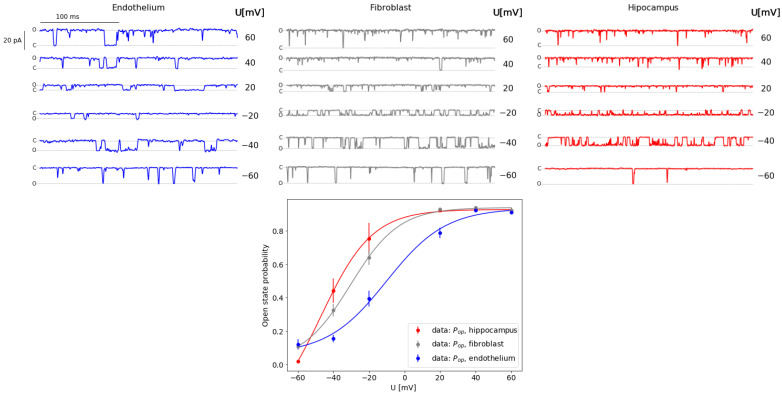
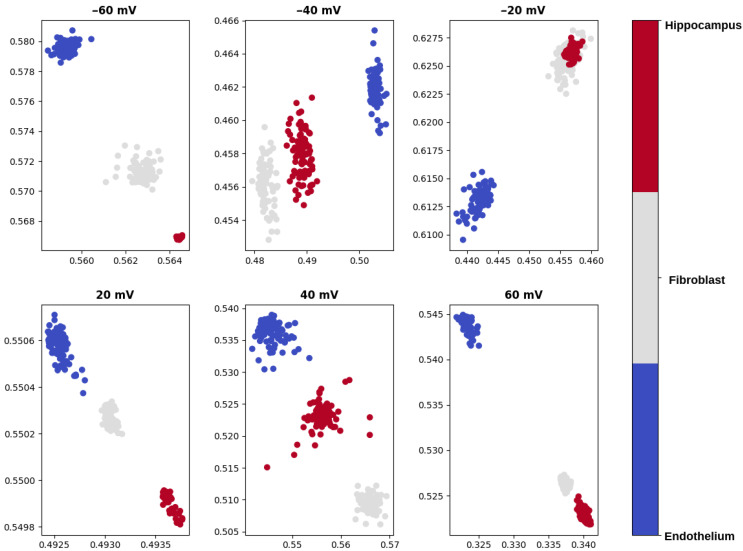
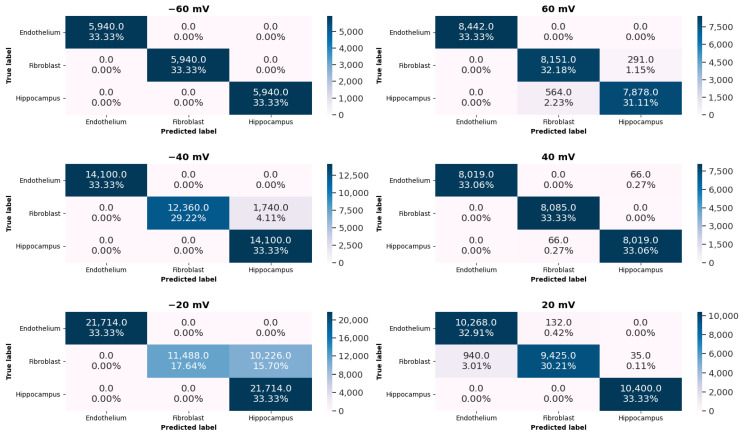
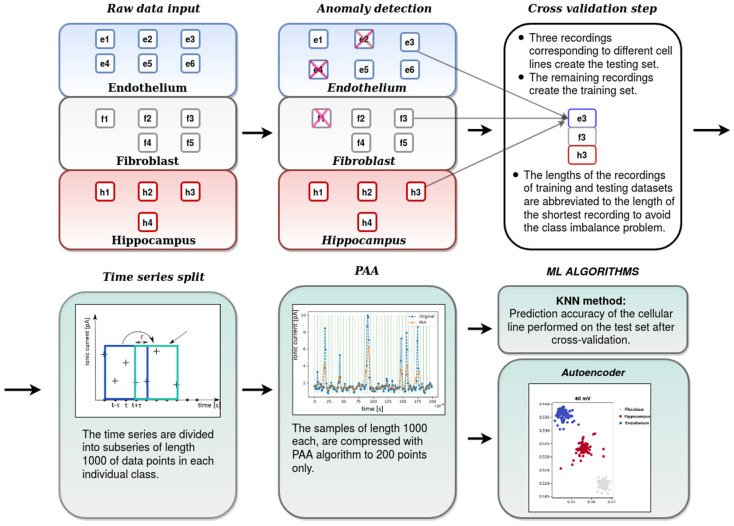
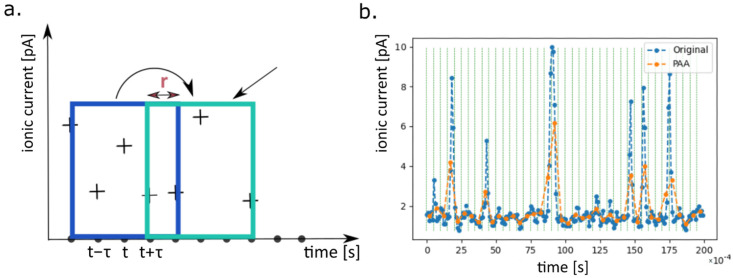
(1) Background: In this work, we focus on the activity of large-conductance voltage- and Ca2+-activated potassium channels (BK) from the inner mitochondrial membrane (mitoBK). The characteristic electrophysiological features of the mitoBK channels are relatively high single-channel conductance (ca. 300 pS) and types of activating and deactivating stimuli. Nevertheless, depending on the isoformal composition of mitoBK channels in a given membrane patch and the type of auxiliary regulatory subunits (which can be co-assembled to the mitoBK channel protein) the characteristics of conformational dynamics of the channel protein can be altered. Consequently, the individual features of experimental series describing single-channel activity obtained by patch-clamp method can also vary. (2) Methods: Artificial intelligence approaches (deep learning) were used to classify the patch-clamp outputs of mitoBK activity from different cell types. (3) Results: Application of the K-nearest neighbors algorithm (KNN) and the autoencoder neural network allowed to perform the classification of the electrophysiological signals with a very good accuracy, which indicates that the conformational dynamics of the analyzed mitoBK channels from different cell types significantly differs. (4) Conclusion: We displayed the utility of machine-learning methodology in the research of ion channel gating, even in cases when the behavior of very similar microbiosystems is analyzed. A short excerpt from the patch-clamp recording can serve as a "fingerprint" used to recognize the mitoBK gating dynamics in the patches of membrane from different cell types.
Keywords: K-nearest neighbors algorithm; autoencoder; gating dynamics; machine learning; mitoBK channels.
Conflict of interest statement
All authors declare no conflict of interests.
Figures
Similar articles
-
To what extent naringenin binding and membrane depolarization shape mitoBK channel gating-A machine learning approach.PLoS Comput Biol. 2022 Jul 20;18(7):e1010315. doi: 10.1371/journal.pcbi.1010315. eCollection 2022 Jul. PLoS Comput Biol. 2022. PMID: 35857767 Free PMC article.
-
Dynamical diversity of mitochondrial BK channels located in different cell types.Biosystems. 2021 Jan;199:104310. doi: 10.1016/j.biosystems.2020.104310. Epub 2020 Nov 25. Biosystems. 2021. PMID: 33248202
-
Differences in Gating Dynamics of BK Channels in Cellular and Mitochondrial Membranes from Human Glioblastoma Cells Unraveled by Short- and Long-Range Correlations Analysis.Cells. 2020 Oct 15;9(10):2305. doi: 10.3390/cells9102305. Cells. 2020. PMID: 33076484 Free PMC article.
-
BK in Double-Membrane Organelles: A Biophysical, Pharmacological, and Functional Survey.Front Physiol. 2021 Oct 26;12:761474. doi: 10.3389/fphys.2021.761474. eCollection 2021. Front Physiol. 2021. PMID: 34764886 Free PMC article. Review.
-
Potassium channels in brain mitochondria.Acta Biochim Pol. 2009;56(3):385-92. Epub 2009 Sep 17. Acta Biochim Pol. 2009. PMID: 19759922 Review.
Cited by
-
Deep Learning-Based Ion Channel Kinetics Analysis for Automated Patch Clamp Recording.Adv Sci (Weinh). 2025 Mar;12(12):e2404166. doi: 10.1002/advs.202404166. Epub 2024 Dec 31. Adv Sci (Weinh). 2025. PMID: 39737527 Free PMC article.
-
To what extent naringenin binding and membrane depolarization shape mitoBK channel gating-A machine learning approach.PLoS Comput Biol. 2022 Jul 20;18(7):e1010315. doi: 10.1371/journal.pcbi.1010315. eCollection 2022 Jul. PLoS Comput Biol. 2022. PMID: 35857767 Free PMC article.
-
Machine Learning Methods for the Analysis of the Patch-Clamp Signals.Methods Mol Biol. 2024;2796:249-270. doi: 10.1007/978-1-0716-3818-7_15. Methods Mol Biol. 2024. PMID: 38856906
-
Harnessing the potential of human induced pluripotent stem cells, functional assays and machine learning for neurodevelopmental disorders.Front Neurosci. 2025 Jan 8;18:1524577. doi: 10.3389/fnins.2024.1524577. eCollection 2024. Front Neurosci. 2025. PMID: 39844857 Free PMC article. Review.
References
-
- Amato F., López A., Peña-Méndez E.M., Vaňhara P., Hampl A., Havel J. Artificial neural networks in medical diagnosis. J. Appl. Biomed. 2013;11:47–58. doi: 10.2478/v10136-012-0031-x. - DOI
MeSH terms
Substances
Grants and funding
LinkOut - more resources
Full Text Sources
Other Literature Sources
Miscellaneous
