

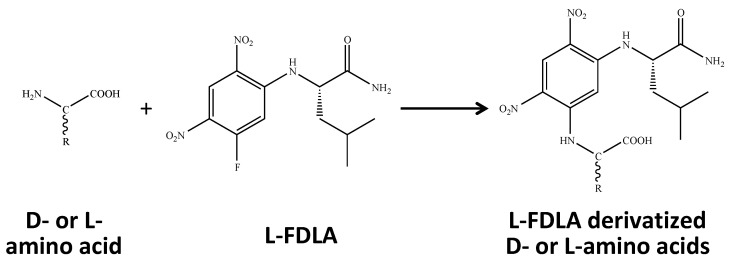
Simultaneous Measurement of Amino Acid Enantiomers in Aged Mouse Brain Samples by LC/MS/MS Combined with Derivatization Using N α-(5-Fluoro-2,4-dinitrophenyl)-l-leucinamide (l-FDLA)
- PMID: 33467775
- PMCID: PMC7829926
- DOI: 10.3390/metabo11010057
Simultaneous Measurement of Amino Acid Enantiomers in Aged Mouse Brain Samples by LC/MS/MS Combined with Derivatization Using N α-(5-Fluoro-2,4-dinitrophenyl)-l-leucinamide (l-FDLA)
Abstract
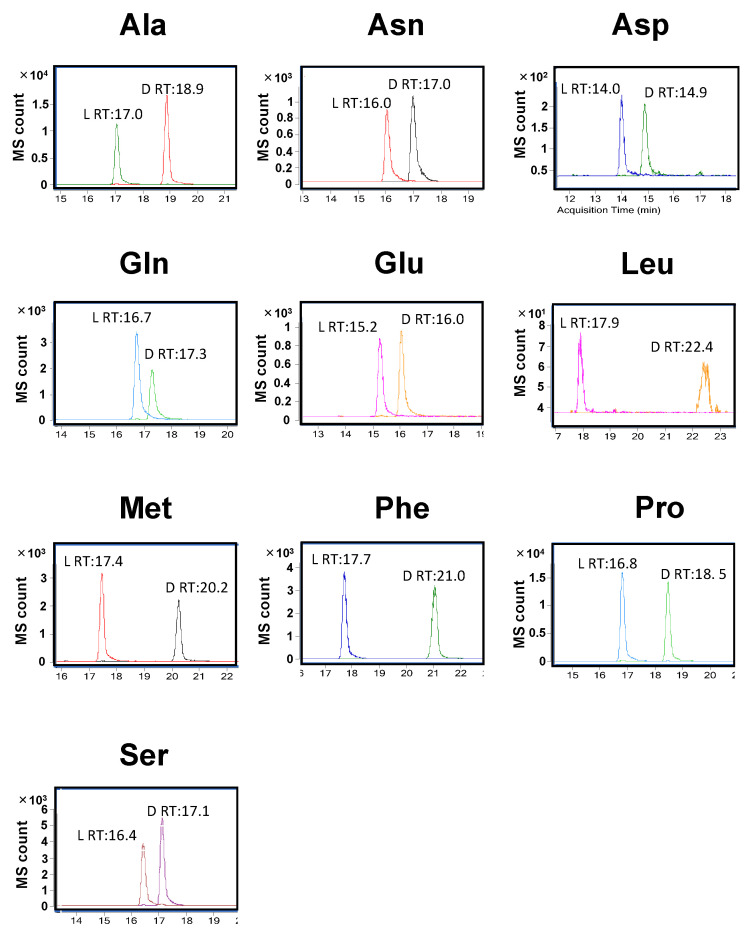
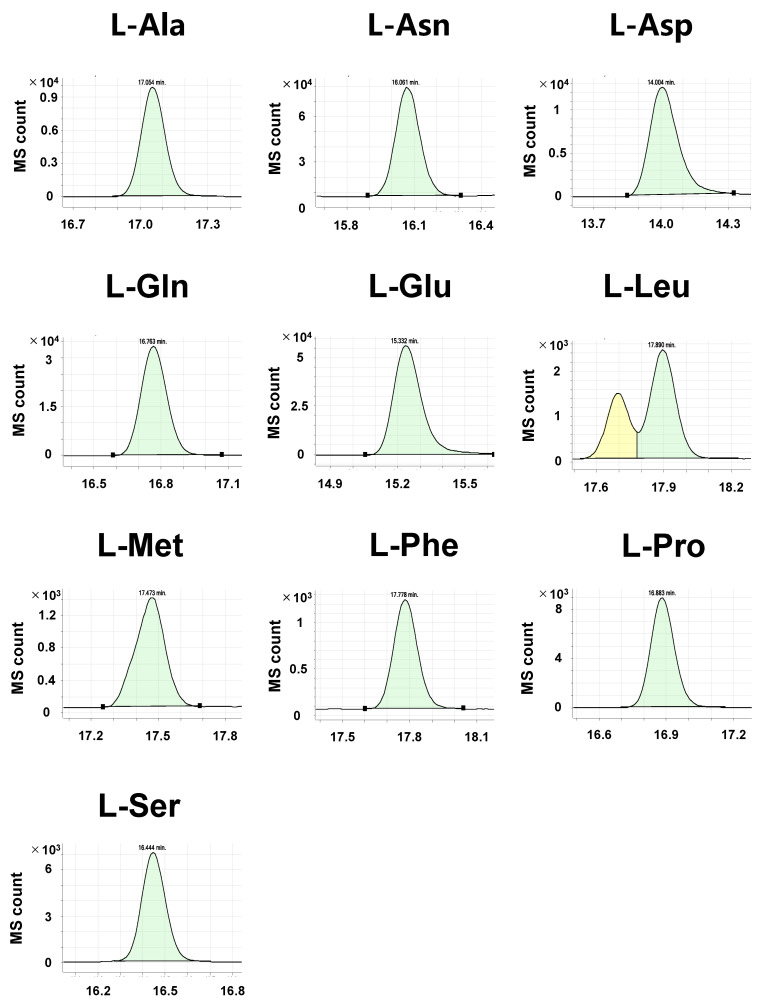
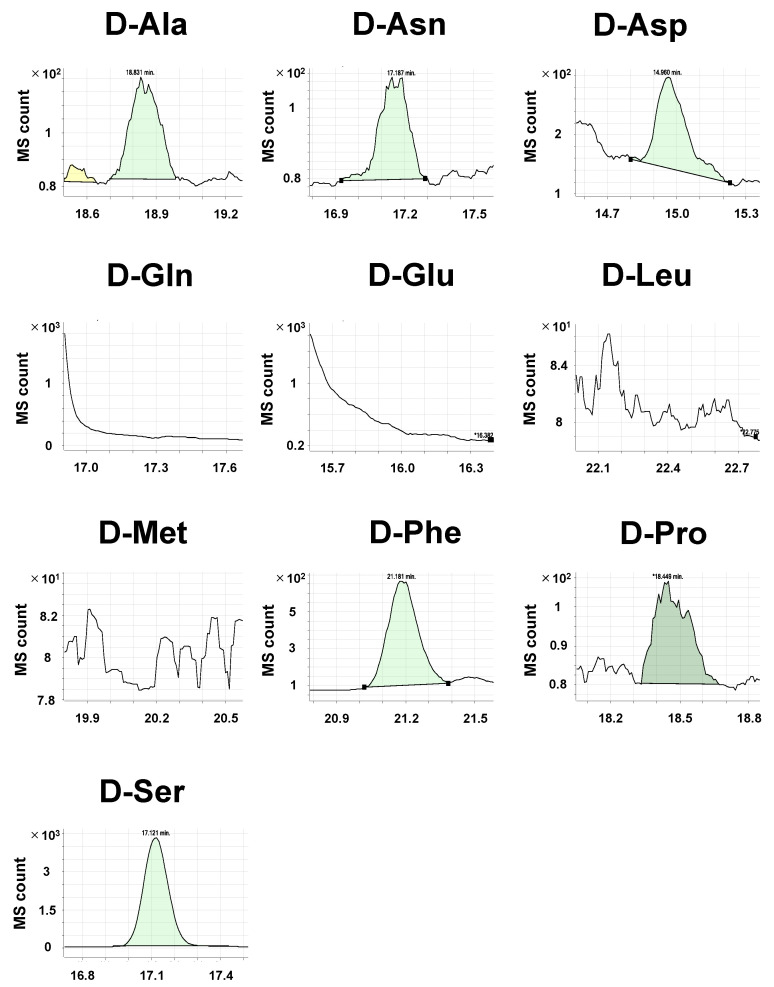
D-amino acids have distinct roles from their l-enantiomer. In particular, some D-amino acids function as agonists or antagonists of neuronal receptors and are involved in higher brain functions. Thus, it is important to precisely measure the levels of these amino acid enantiomers in cells and tissues. Various quantification methods have been developed for measurements of chiral amino acids. However, each method has advantages and disadvantages. Additionally, measuring the amino acid enantiomers in crude biological samples requires a higher selectivity. In this study, we developed a quantification method for amino acid enantiomers using derivatization with N α-(5-Fluoro-2,4-dinitrophenyl)-l-leucinamide (l-FDLA) followed by liquid chromatography-tandem mass spectrometry (LC/MS/MS) with a conventional reversed-phase column. We simultaneously identified 10 chiral amino acids. Furthermore, we applied this method to investigate murine tissue samples and examined the effect of aging on the amino acid levels in aged brain regions. We found that aging decreased the levels of both D-serine and D-aspartate in the hippocampus. In addition, D-Phenylalanine in the thalamus significantly increased with age. In conclusion, our method is suitable for the quantification of the D-amino acids in crude biological samples and may contribute to elucidating the biological roles of chiral amino acids.
Keywords: D-amino acid; LC/MS/MS; aging; brain; l-FDLA.
Conflict of interest statement
The authors declare no conflict of interests.
Figures
References
-
- Usiello A., Di Fiore M.M., De Rosa A., Falvo S., Errico F., Santillo A., Nuzzo T., Chieffi Baccari G. New Evidence on the Role of d-Aspartate Metabolism in Regulating Brain and Endocrine System Physiology: From Preclinical Observations to Clinical Applications. Int. J. Mol. Sci. 2020;21:8718. doi: 10.3390/ijms21228718. - DOI - PMC - PubMed
Grants and funding
LinkOut - more resources
Full Text Sources
Other Literature Sources
