. 2021 Jan 15;22(2):849.
doi: 10.3390/ijms22020849.

The Interaction of the Senescent and Adjacent Breast Cancer Cells Promotes the Metastasis of Heterogeneous Breast Cancer Cells through Notch Signaling

Affiliations

The Interaction of the Senescent and Adjacent Breast Cancer Cells Promotes the Metastasis of Heterogeneous Breast Cancer Cells through Notch Signaling

Na Zhang et al. Int J Mol Sci. .

Abstract

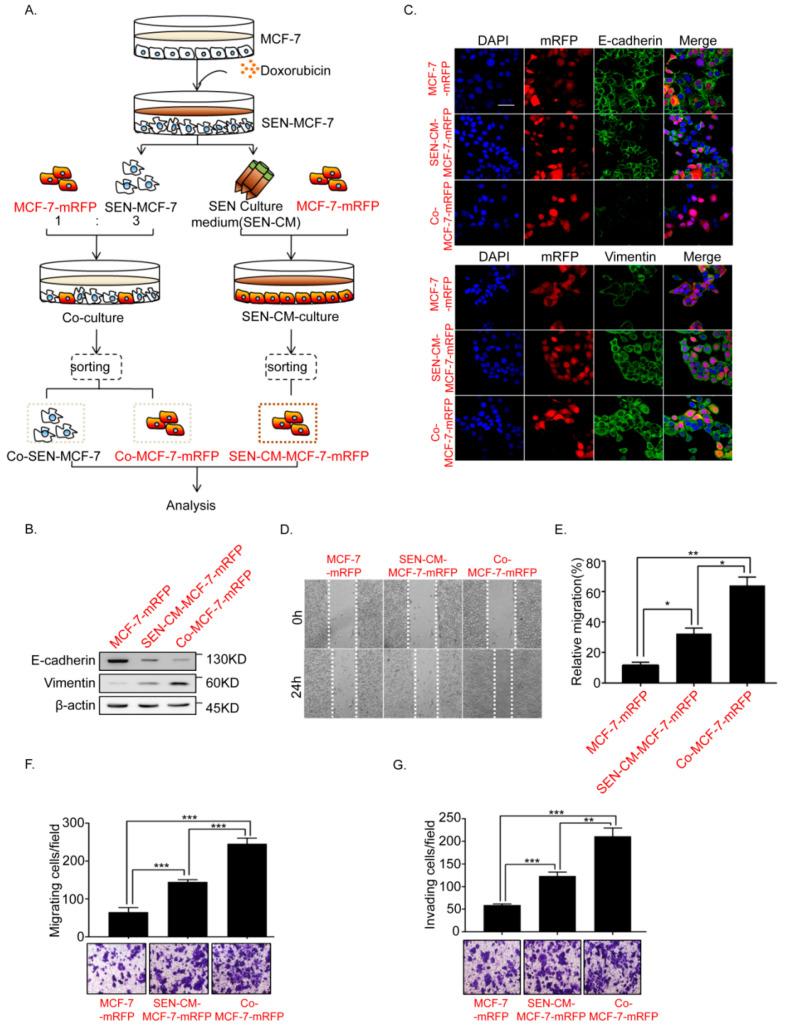
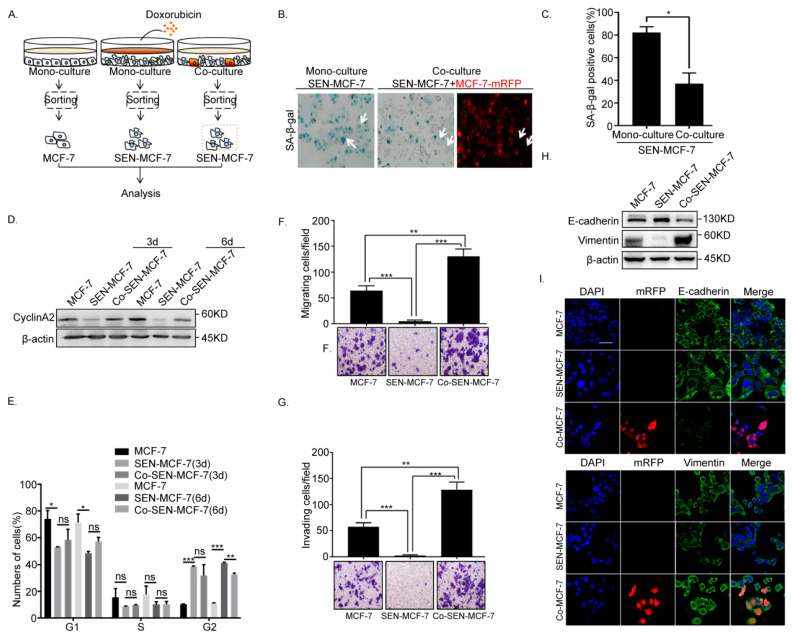
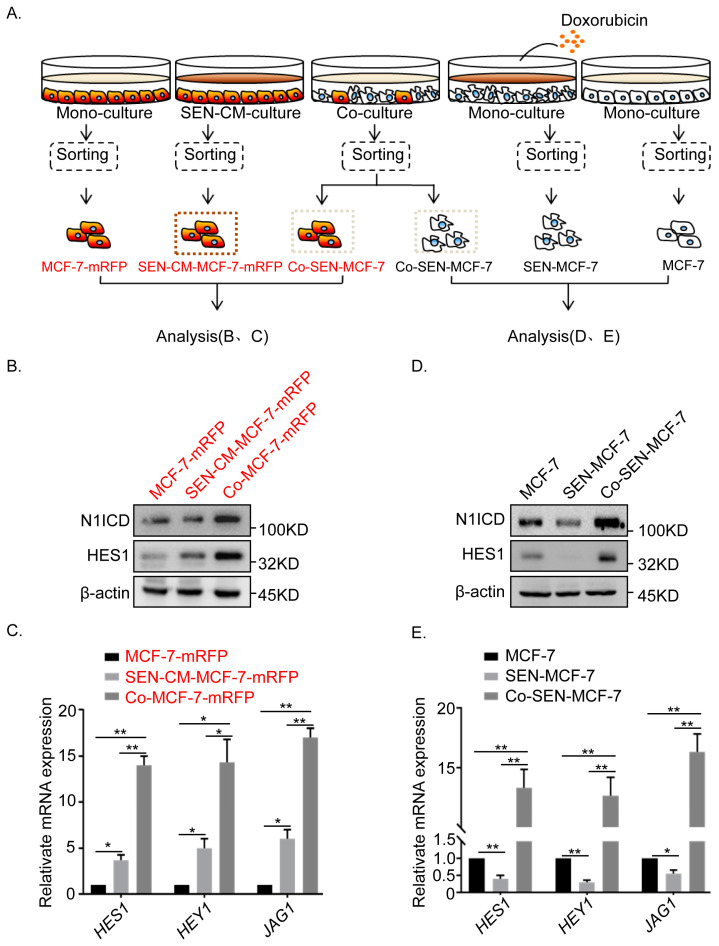
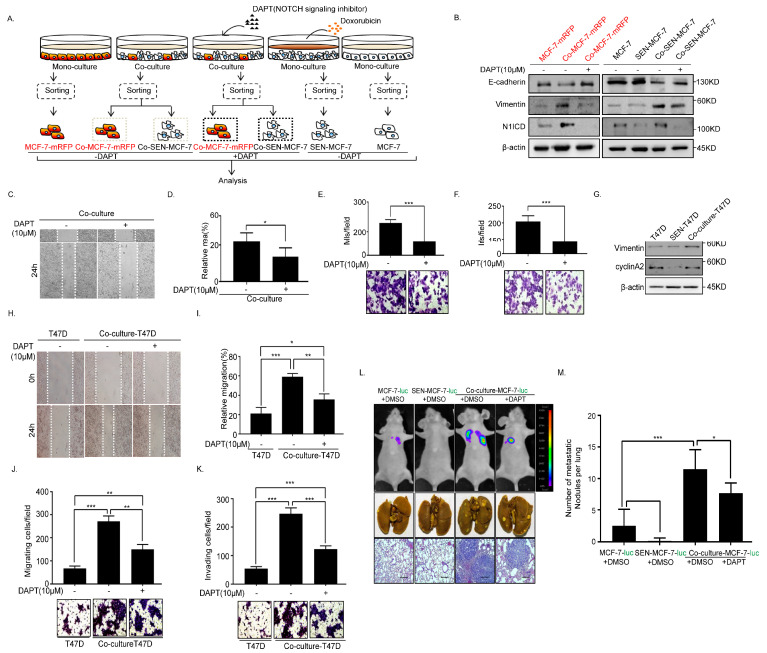
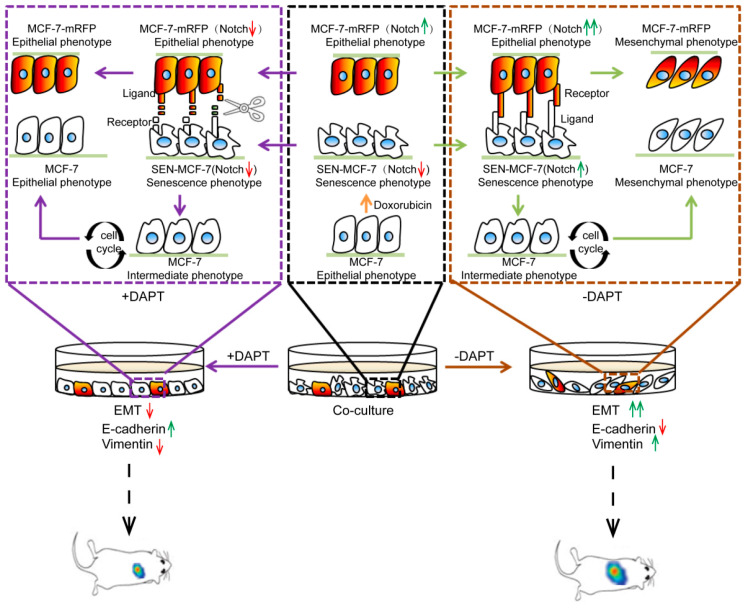
Chemotherapy is one of the most common strategies for tumor treatment but often associated with post-therapy tumor recurrence. While chemotherapeutic drugs are known to induce tumor cell senescence, the roles and mechanisms of senescence in tumor recurrence remain unclear. In this study, we used doxorubicin to induce senescence in breast cancer cells, followed by culture of breast cancer cells with conditional media of senescent breast cancer cells (indirect co-culture) or directly with senescent breast cancer cells (direct co-culture). We showed that breast cancer cells underwent the epithelial-mesenchymal transition (EMT) to a greater extent and had stronger migration and invasion ability in the direct co-culture compared with that in the indirect co-culture model. Moreover, in the direct co-culture model, non-senescent breast cancer cells facilitated senescent breast cancer cells to escape and re-enter into the cell cycle. Meanwhile, senescent breast cancer cells regained tumor cell characteristics and underwent EMT after direct co-culture. We found that the Notch signaling was activated in both senescent and non-senescent breast cancer cells in the direct co-culture group. Notably, the EMT process of senescent and adjacent breast cancer cells was blocked upon inhibition of Notch signaling with N-[(3,5-difluorophenyl)acetyl]-l-alanyl-2-phenyl]glycine-1,1-dimethylethyl ester (DAPT) in the direct co-cultures. In addition, DAPT inhibited the lung metastasis of the co-cultured breast cancer cells in vivo. Collectively, data arising from this study suggest that both senescent and adjacent non-senescent breast cancer cells developed EMT through activating Notch signaling under conditions of intratumoral heterogeneity caused by chemotherapy, which infer the possibility that Notch inhibitors used in combination with chemotherapeutic agents may become an effective treatment strategy.

Keywords: EMT; Notch signaling; breast cancer cells senescence; co-culture system; doxorubicin.


Conflict of interest statement

The authors declare that they have no conflict of interest.

Figures

Figure 1
Figure 1
Doxorubicin (Dox)-induced MCF-7 cell senescence promoted the epithelial–mesenchymal transition (EMT) of adjacent breast cancer cells. (A) Schematic diagram showing the experimental setup. Schematic diagram of the co-culture systems. Senescent MCF-7 cells (SEN-MCF-7) induced by Dox (200nM) were co-cultured with MCF-7-mRFP at a 3:1 ratio (SEN-MCF-7:MCF7-mRFP). Senescent MCF-7 cells (SEN-MCF-7) were recovered from the supernatant and mixed with normal medium at a 3:1 ratio (senescence supernatant: normal medium) as conditional medium (SEN-CM) for MCF7-mRFP cell monocultures. Red and black letters, used to distinguish two types of MCF-7 cells. Red letters: MCF-7 cells fused to red fluorescent protein, mRFP. Black letters: MCF-7 cells without fusing to mRFP. (B) Immunoblot analysis of protein expression of the epithelial marker E-cadherin and mesenchymal marker Vimentin in MCF-7-mRFP cells with the indicated treatments. (C) Immunofluorescence staining for EMT markers in MCF-7-mRFP cells with the indicated treatments. Scale bar, 50μm. (D,E) Wound-healing assay of MCF-7-mRFP cells with the indicated treatments. (D) Representative micrographs of wound-healing assay are shown. (E) Data represent the relative migration ratio of cells per field (error bars indicate mean SD, n = 3 experimental replicates, * p < 0.05, ** p < 0.01, *** p < 0.001). (F) Migration assay of MCF-7-mRFP cells with the indicated treatments. Representative micrographs of the migrated cells are shown. Data represent the number of cells derived from mean cell counts of five fields (Error bars indicate mean SD, n = 3 experimental replicates, * p < 0.05, ** p < 0.01, *** p < 0.001). (G) Invasion assay of MCF-7-mRFP cells with the indicated treatments. Representative micrographs of the migrated cells are shown. Data represent the number of cells derived from mean cell counts of five fields (Error bars indicate mean SD, n = 3 experimental replicates, * p < 0.05, ** p < 0.01, *** p < 0.001).
Figure 2
Figure 2
Senescent MCF-7 cells re-entered the cell cycle and underwent EMT in the co-culture. (A) Left: Scheme showing the experimental setup. Flow cytometry sorting of collected senescence breast cancer cells (Co-SEN-MCF-7) co-cultured with MCF-7-mRFP for 3 or 6 days. (B,C) β-Gal staining analysis of MCF-7 cells subjected to the indicated treatments and fluorescence microscopy of MCF-7-mRFP cells. Arrow, senescent MCF-7 cells (SEN-MCF-7 and Co-SEN-MCF-7). (B) Representative images. (C) Percentage of β-gal positive cells (error bars indicate the mean SD, n = 3 experimental replicates, * p < 0.05). (D) Right: Immunoblot analysis of protein expression of cyclinA2 in MCF-7 cells with the indicated treatments. (E) Cell cycle analysis of MCF-7 cells with the indicated treatments. Percentages of cell subpopulations at different cell cycle phases based on triplicate experiments (Error bars indicate mean SD, n = 3 experimental replicates, * p < 0.05, ** p < 0.01, *** p < 0.001). (F) Migration assays of MCF-7 cells with the indicated treatments. Representative micrographs of migrated cells are shown. Data represent the number of cells derived from mean cell counts of five fields (error bars indicate mean SD, n = 3 experimental replicates, ** p < 0.01, *** p < 0.001). (G) Invasion assay of MCF-7 cells with the indicated treatments. Representative micrographs of migrated cells are shown. Data represent the number of cells derived from mean cell counts of five fields (Error bars indicate mean SD, n = 3 experimental replicates, ** p < 0.01, *** p < 0.001). (H) Immunoblot analysis of protein expression of the epithelial marker, E-cadherin, and mesenchymal marker, Vimentin, in MCF-7 cells subjected to the indicated treatments. (I) Immunofluorescence staining of EMT markers in MCF-7 cells subjected to the indicated treatments. Scale bar, 50 μm.
Figure 3
Figure 3
Activation of Notch signaling in both senescent and adjacent non-senescent breast cancer MCF-7 cells. (A) Scheme showing the experimental setup. Flow cytometry sorting of collected breast cancer cells after co-culture or monoculture. (B) Immunoblot analysis of protein expression of active Notch1 intracellular domain (N1ICD) and the canonical Notch target, HES1, assessed in MCF7-mRFP cells subjected to the indicated treatments. (C) RT-qPCR analysis of expression of target genes HES1 and HEY1 and JAG1 in MCF7-mRFP cells subjected to the indicated treatments (error bars indicate mean SD, n = 3 experimental replicates,* p < 0.05, ** p < 0.01). (D) Immunoblot analysis of protein expression of active Notch1 intracellular domain (N1ICD) and the canonical Notch1target, HES1, assessed in MCF-7 cells subjected to the indicated treatments. (E) RT-qPCR analysis of gene expression of target genes HES1 and HEY1 and the JAG1 ligand of Notch in MCF-7 cells subjected to the indicated treatments (error bars indicate the mean SD, n = 3 experimental replicates,* p < 0.05, ** p < 0.01).
Figure 4
Figure 4
N-[(3,5-Difluorophenyl)acetyl]-l-alanyl-2-phenyl]glycine-1,1-dimethylethyl ester (DAPT) inhibits EMT and metastasis of the senescent and adjacent non-senescent breast cancer cells. (A) Scheme showing the experimental setup. Flow cytometry analysis of collected breast cancer cells in co-cultures or monocultures treated with or without DAPT (10 μM). (B) Immunoblot analysis of protein expression of active Notch1 intracellular domain (N1ICD), E-cadherin, and Vimentin in MCF-7-mRFP and MCF-7 cells treated with or without DAPT. (C,D) Wound-healing assay of MCF-7 cells (MCF-7-mRFP and SEN-MCF-7) treated with or without DAPT. (C) Representative micrographs of the wound-healing assay are shown. (D) Data represent the relative migration ratio of cells per field (error bars indicate mean SD, n = 3 experimental replicates, * p < 0.05). (E) Migration assay of MCF-7 cells (MCF-7-mRFP and SEN-MCF-7) treated with or without DAPT. Representative micrographs of migrated cells are shown. Data represent the number of cells derived from mean cell counts of five fields (error bars indicate mean SD, n = 3 experimental replicates, *** p < 0.001). (F) Invasion assay of MCF-7 cells (MCF-7-mRFP and SEN-MCF-7) with indicated treatments. Representative micrographs of the migrated cells are shown. Data represent the number of cells derived from mean cell counts of five fields (error bars indicate mean SD, n = 3 experimental replicates, * p < 0.05, ** p < 0.01, *** p < 0.001). (G) Immunoblot analysis of protein expression of E-cadherin, Vimentin, N1ICD, and cyclinA2 in T47D, SEN-T47D and Co-culture-T47D (which contains T47D and SEN-T47D). (H,I) Wound-healing assay of T47D subjected to the indicated treatments. (H) Representative micrographs of the wound-healing assay are shown. (I) Data represent the relative migration ratio of cells per field (error bars indicate mean SD, n = 3 experimental replicates, * p < 0.05, ** p < 0.01, *** p < 0.001). (J) Migration assays of T47D cells with the indicated treatments. Representative micrographs of migrated cells are shown. Data represent the number of cells derived from mean cell counts of five fields (Error bars indicate mean SD, n = 3 experimental replicates, ** p < 0.01, *** p < 0.001). (K) Invasion assay of T47D cells with the indicated treatments. Representative micrographs of migrated cells are shown. Data represent the number of cells derived from mean cell counts of five fields (error bars indicate mean SD, n = 3 experimental replicates, *** p < 0.001). (L) Lung metastatic nodules were confirmed by hematoxylin and eosin staining. Scale bars, 250μm. (M) The number of visible surface metastatic lesions in lungs was counted (error bars indicate mean SD, n = 6 mice for each group, * p < 0.05, *** p < 0.001).
Figure 5
Figure 5
Role of Notch signaling in EMT caused by doxorubicin-induced tumor cells senescence. A proposed working model of Notch signals involved in breast cancer EMT in the co-cultivation system of senescent breast cancer cells induced by doxorubicin co-cultured with adjacent non-senescent breast cancer cells. Interactions between senescent (SEN-MCF-7) and adjacent non-senescent breast cancer cells (MCF-7-mRFP) through activating the Notch signal promote EMT of adjacent non-senescent breast cancer cells (MCF-7-mRFP) through Notch signaling, accompanied by the downregulation of E-cadherin and upregulation of Vimentin. Meanwhile, senescent breast cancer cells (SEN-MCF-7) return to the cell cycle and acquire migration and invasion ability and EMT properties, which is accompanied by the downregulation of E-cadherin and upregulation of Vimentin. Notch signaling in senescent (SEN-MCF-7) and adjacent non-senescent breast cancer cells (MCF-7-mRFP) is inhibited by treatment with DAPT in the co-cultivation system, which is accompanied by the downregulation of E-cadherin and upregulation of Vimentin in breast cancer cells. Red arrows: inhibition of signaling or downregulation of protein expression. Green arrows: activation of signaling or upregulation of protein expression.

Similar articles

Cited by

References

    1. Gilbert L.A., Hemann M.T. Chemotherapeutic Resistance: Surviving Stressful Situations. Cancer Res. 2011;71:5062–5066. doi: 10.1158/0008-5472.CAN-11-0277. - DOI - PMC - PubMed
    1. Middleton J.D., Stover D.G., Hai T. Chemotherapy-Exacerbated Breast Cancer Metastasis: A Paradox Explainable by Dysregulated Adaptive-Response. Int. J. Mol. Sci. 2018;19:3333. doi: 10.3390/ijms19113333. - DOI - PMC - PubMed
    1. Stewart C.A., Gay C.M., Xi Y., Sivajothi S., Sivakamasundari V., Fujimoto J., Bolisetty M., Hartsfield P.M., Balasubramaniyan V., Chalishazar M.D., et al. Single-cell analyses reveal increased intratumoral heterogeneity after the onset of therapy resistance in small-cell lung cancer. Nat. Rev. Cancer. 2020;1:423–436. doi: 10.1038/s43018-019-0020-z. - DOI - PMC - PubMed
    1. Ljungkvist A.S.E., Bussink J., Rijken P.F.J.W., Kaanders J.H.A.M., Van Der Kogel A.J., Denekamp J. Vascular architecture, hypoxia, and proliferation in first-generation xenografts of human head-and-neck squamous cell carcinomas. Int. J. Radiat. Oncol. 2002;54:215–228. doi: 10.1016/S0360-3016(02)02938-3. - DOI - PubMed
    1. Vaupel P. Tumor microenvironmental physiology and its implications for radiation oncology. Semin. Radiat. Oncol. 2004;14:198–206. doi: 10.1016/j.semradonc.2004.04.008. - DOI - PubMed

MeSH terms

LinkOut - more resources