

Trophic consequences of terrestrial eutrophication for a threatened ungulate
- PMID: 33468013
- PMCID: PMC7893279
- DOI: 10.1098/rspb.2020.2811
Trophic consequences of terrestrial eutrophication for a threatened ungulate
Abstract
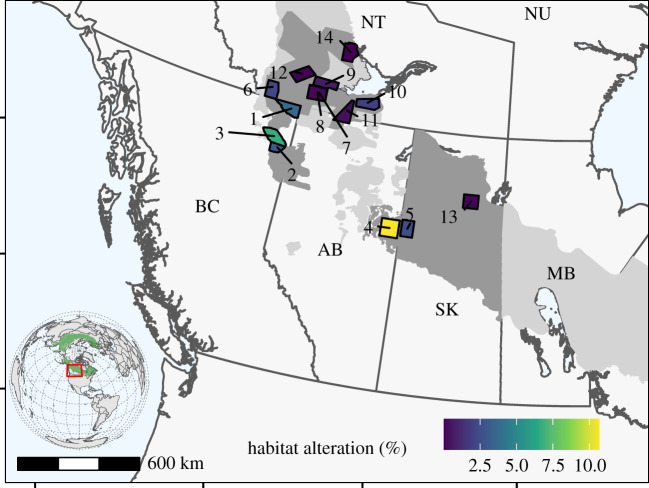
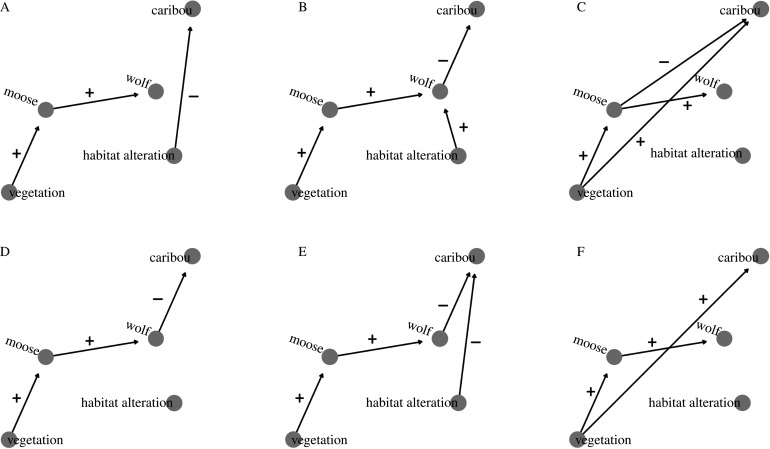
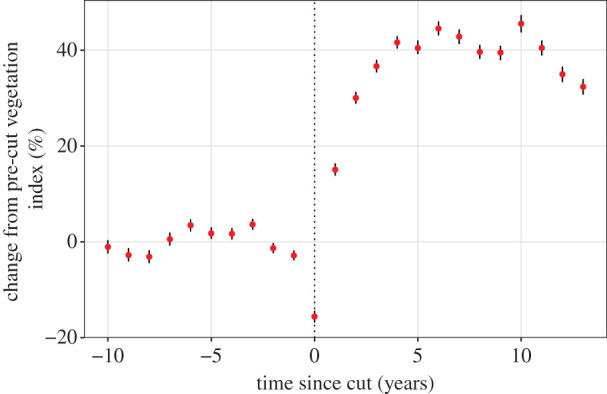
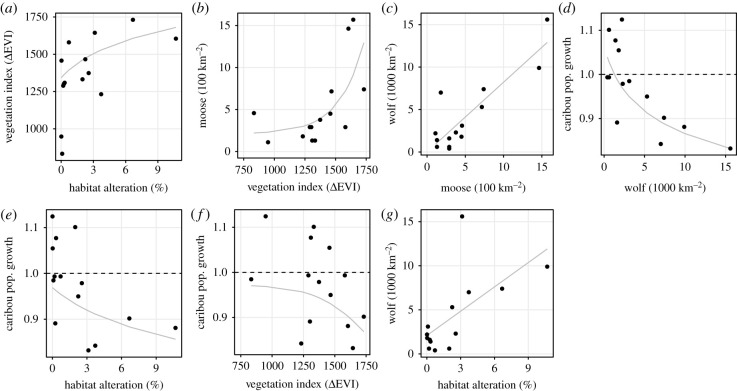
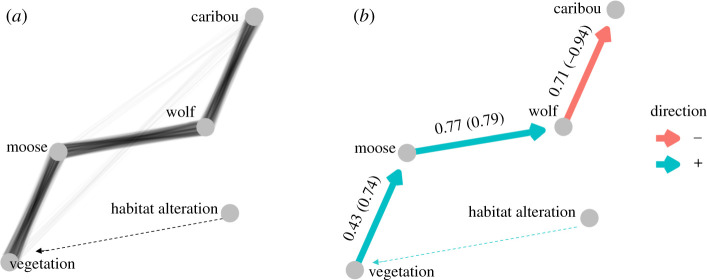
Changes in primary productivity have the potential to substantially alter food webs, with positive outcomes for some species and negative outcomes for others. Understanding the environmental context and species traits that give rise to these divergent outcomes is a major challenge to the generality of both theoretical and applied ecology. In aquatic systems, nutrient-mediated eutrophication has led to major declines in species diversity, motivating us to seek terrestrial analogues using a large-mammal system across 598 000 km2 of the Canadian boreal forest. These forests are undergoing some of the most rapid rates of land-use change on Earth and are home to declining caribou (Rangifer tarandus caribou) populations. Using satellite-derived estimates of primary productivity, coupled with estimates of moose (Alces alces) and wolf (Canis lupus) abundance, we used path analyses to discriminate among hypotheses explaining how habitat alteration can affect caribou population growth. Hypotheses included food limitation, resource dominance by moose over caribou, and apparent competition with predators shared between moose and caribou. Results support apparent competition and yield estimates of wolf densities (1.8 individuals 1000 km-2) above which caribou populations decline. Our multi-trophic analysis provides insight into the cascading effects of habitat alteration from forest cutting that destabilize terrestrial predator-prey dynamics. Finally, the path analysis highlights why conservation actions directed at the proximate cause of caribou decline have been more successful in the near term than those directed further along the trophic chain.
Keywords: apparent competition; boreal; food webs; global change; path analysis; woodland caribou.
Conflict of interest statement
We declare we have no competing interests.
Figures
Similar articles
-
Indigenous-led conservation: Pathways to recovery for the nearly extirpated Klinse-Za mountain caribou.Ecol Appl. 2022 Jul;32(5):e2581. doi: 10.1002/eap.2581. Epub 2022 Jun 5. Ecol Appl. 2022. PMID: 35319140 Free PMC article. Review.
-
Multi-trophic resource selection function enlightens the behavioural game between wolves and their prey.J Anim Ecol. 2013 Sep;82(5):1062-71. doi: 10.1111/1365-2656.12093. Epub 2013 May 23. J Anim Ecol. 2013. PMID: 23701257
-
The importance of considering multiple interacting species for conservation of species at risk.Conserv Biol. 2019 Jun;33(3):709-715. doi: 10.1111/cobi.13233. Epub 2018 Dec 19. Conserv Biol. 2019. PMID: 30306635
-
Evaluating the impact of caribou habitat restoration on predator and prey movement.Conserv Biol. 2023 Apr;37(2):e14004. doi: 10.1111/cobi.14004. Epub 2023 Jan 25. Conserv Biol. 2023. PMID: 36098630
-
Capital and income breeding traits differentiate trophic match-mismatch dynamics in large herbivores.Philos Trans R Soc Lond B Biol Sci. 2013 Jul 8;368(1624):20120484. doi: 10.1098/rstb.2012.0484. Print 2013 Aug 19. Philos Trans R Soc Lond B Biol Sci. 2013. PMID: 23836789 Free PMC article. Review.
Cited by
-
Demographic responses of nearly extirpated endangered mountain caribou to recovery actions in Central British Columbia.Ecol Appl. 2022 Jul;32(5):e2580. doi: 10.1002/eap.2580. Epub 2022 Jun 5. Ecol Appl. 2022. PMID: 35319129 Free PMC article.
-
Indigenous-led conservation: Pathways to recovery for the nearly extirpated Klinse-Za mountain caribou.Ecol Appl. 2022 Jul;32(5):e2581. doi: 10.1002/eap.2581. Epub 2022 Jun 5. Ecol Appl. 2022. PMID: 35319140 Free PMC article. Review.
-
Demographic responses of a threatened, low-density ungulate to annual variation in meteorological and phenological conditions.PLoS One. 2021 Oct 8;16(10):e0258136. doi: 10.1371/journal.pone.0258136. eCollection 2021. PLoS One. 2021. PMID: 34624030 Free PMC article.
-
The Erosion of Threatened Southern Mountain Caribou Migration.Glob Chang Biol. 2025 Mar;31(3):e70095. doi: 10.1111/gcb.70095. Glob Chang Biol. 2025. PMID: 40026175 Free PMC article.
-
Causal attribution from retrospective data in Canada's woodland caribou system.Ecol Appl. 2025 Apr;35(3):e70022. doi: 10.1002/eap.70022. Ecol Appl. 2025. PMID: 40309779 Free PMC article.
References
-
- Zhu Z, et al. 2016. Greening of the Earth and its drivers. Nat. Clim. Chang. 6, 791–795. (10.1038/nclimate3004) - DOI
-
- Grime JP 1973. Control of species density in herbaceous vegetation. J. Environ. Manage 1, 151–167.
Publication types
MeSH terms
Associated data
LinkOut - more resources
Full Text Sources
Other Literature Sources
