

Continuous monitoring of plant sodium transport dynamics using clinical PET
- PMID: 33468197
- PMCID: PMC7814562
- DOI: 10.1186/s13007-021-00707-8
Continuous monitoring of plant sodium transport dynamics using clinical PET
Abstract
Background: The absorption, translocation, accumulation and excretion of substances are fundamental processes in all organisms including plants, and have been successfully studied using radiotracers labelled with 11C, 13N, 14C and 22Na since 1939. Sodium is one of the most damaging ions to the growth and productivity of crops. Due to the significance of understanding sodium transport in plants, a significant number of studies have been carried out to examine sodium influx, compartmentation, and efflux using 22Na- or 24Na-labeled salts. Notably, however, most of these studies employed destructive methods, which has limited our understanding of sodium flux and distribution characteristics in real time, in live plants. Positron emission tomography (PET) has been used successfully in medical research and diagnosis for decades. Due to its ability to visualise and assess physiological and metabolic function, PET imaging has also begun to be employed in plant research. Here, we report the use of a clinical PET scanner with a 22Na tracer to examine 22Na-influx dynamics in barley plants (Hordeum vulgare L. spp. Vulgare-cultivar Bass) under variable nutrient levels, alterations in the day/night light cycle, and the presence of sodium channel inhibitors.
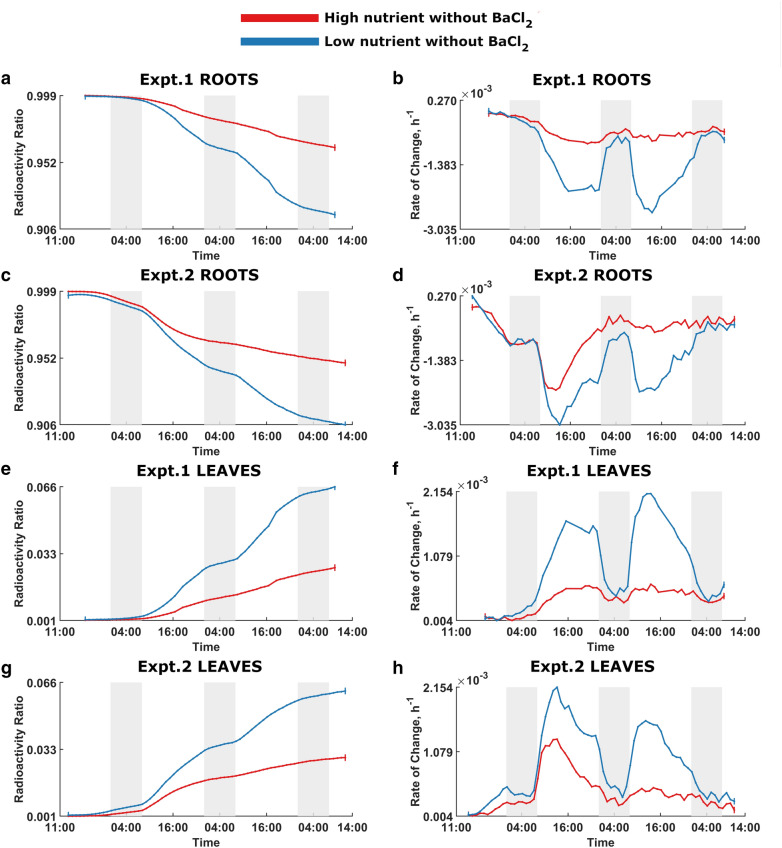
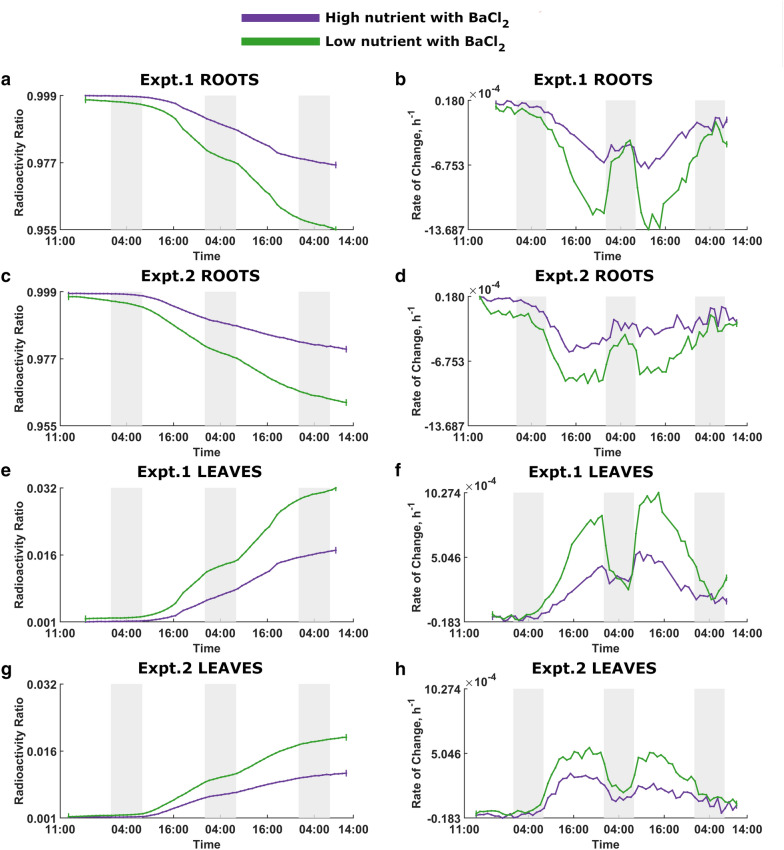
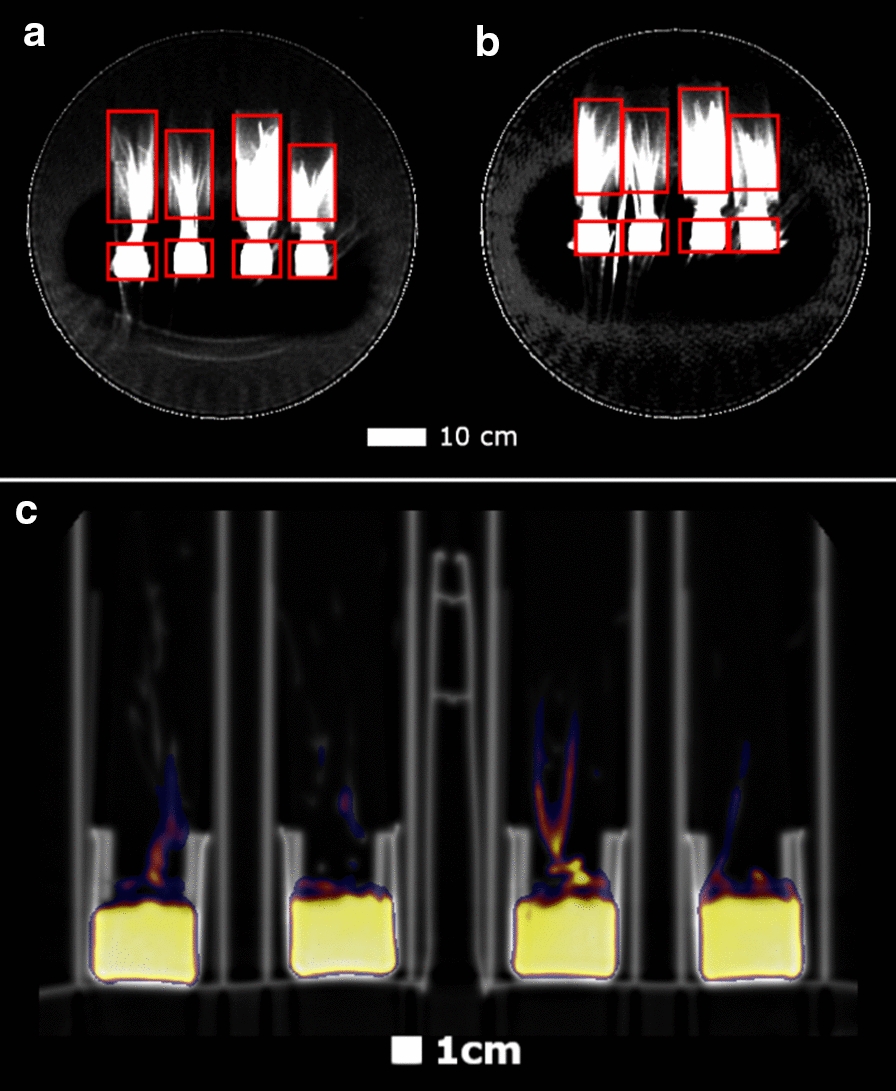
Results: 3D dynamic PET images of whole plants show readily visible 22Na translocation from roots to shoots in each examined plant, with rates influenced by both nutrient status and channel inhibition. PET images show that plants cultivated in low-nutrient media transport more 22Na than plants cultivated in high-nutrient media, and that 22Na uptake is suppressed in the presence of a cation-channel inhibitor. A distinct diurnal pattern of 22Na influx was discernible in curves displaying rates of change of relative radioactivity. Plants were found to absorb more 22Na during the light period, and anticipate the change in the light/dark cycle by adjusting the sodium influx rate downward in the dark period, an effect not previously described experimentally.
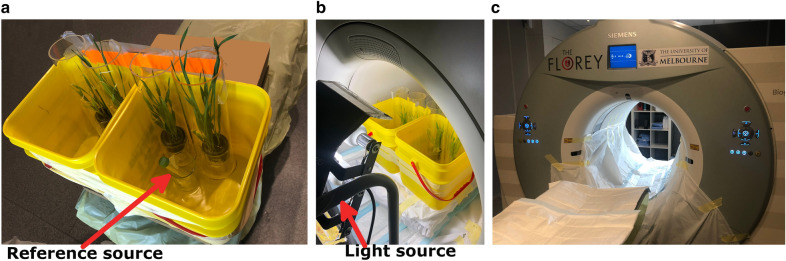
Conclusions: We demonstrate the utility of clinical PET/CT scanners for real-time monitoring of the temporal dynamics of sodium transport in plants. The effects of nutrient deprivation and of ion channel inhibition on sodium influx into barley plants are shown in two proof-of-concept experiments, along with the first-ever 3D-imaging of the light and dark sodium uptake cycles in plants. This method carries significant potential for plant biology research and, in particular, in the context of genetic and treatment effects on sodium acquisition and toxicity in plants.
Keywords: 22Na transport dynamics; Barley; Diurnal transport; Inhibitor effect; Nutrient effect; Positron emission tomography.
Conflict of interest statement
The authors declare that they have no competing interests.
Figures


Similar articles
-
Imaging Salt Uptake Dynamics in Plants Using PET.Sci Rep. 2019 Dec 9;9(1):18626. doi: 10.1038/s41598-019-54781-z. Sci Rep. 2019. PMID: 31819118 Free PMC article.
-
A pharmacological analysis of high-affinity sodium transport in barley (Hordeum vulgare L.): a 24Na+/42K+ study.J Exp Bot. 2012 Apr;63(7):2479-89. doi: 10.1093/jxb/err419. Epub 2012 Jan 20. J Exp Bot. 2012. PMID: 22268152 Free PMC article.
-
Differences in efficient metabolite management and nutrient metabolic regulation between wild and cultivated barley grown at high salinity.Plant Biol (Stuttg). 2010 Jul 1;12(4):650-8. doi: 10.1111/j.1438-8677.2009.00265.x. Plant Biol (Stuttg). 2010. PMID: 20636908
-
Na+ transport in plants.FEBS Lett. 2007 May 25;581(12):2247-54. doi: 10.1016/j.febslet.2007.04.014. Epub 2007 Apr 18. FEBS Lett. 2007. PMID: 17459382 Review.
-
Na(+) transport in glycophytic plants: what we know and would like to know.Plant Cell Environ. 2010 Apr;33(4):612-26. doi: 10.1111/j.1365-3040.2009.02086.x. Epub 2009 Nov 24. Plant Cell Environ. 2010. PMID: 19968828 Review.
Cited by
-
Design Study of a Novel Positron Emission Tomography System for Plant Imaging.Front Plant Sci. 2022 Jan 18;12:736221. doi: 10.3389/fpls.2021.736221. eCollection 2021. Front Plant Sci. 2022. PMID: 35116047 Free PMC article.
-
Capturing crop adaptation to abiotic stress using image-based technologies.Open Biol. 2022 Jun;12(6):210353. doi: 10.1098/rsob.210353. Epub 2022 Jun 22. Open Biol. 2022. PMID: 35728624 Free PMC article. Review.
-
"Live-Autoradiography" Technique Reveals Genetic Variation in the Rate of Fe Uptake by Barley Cultivars.Plants (Basel). 2022 Mar 18;11(6):817. doi: 10.3390/plants11060817. Plants (Basel). 2022. PMID: 35336699 Free PMC article.
-
Time-resolved chemical monitoring of whole plant roots with printed electrochemical sensors and machine learning.Sci Adv. 2024 Feb 2;10(5):eadj6315. doi: 10.1126/sciadv.adj6315. Epub 2024 Jan 31. Sci Adv. 2024. PMID: 38295162 Free PMC article.
-
Plant-on-a-chip: continuous, soilless electrochemical monitoring of salt uptake and tolerance among different genotypes of tomato.Sens Diagn. 2024 Apr 11;3(5):799-808. doi: 10.1039/d4sd00065j. eCollection 2024 May 16. Sens Diagn. 2024. PMID: 38766392 Free PMC article.
References
-
- Converse AK, Ahlers EO, Bryan TW, Hetue JD, Lake KA, Ellison PA, Engle JW, Barnhart TE, Nickles RJ, Williams PH, DeJesus OT. Mathematical modeling of positron emission tomography (PET) data to assess radiofluoride transport in living plants following petiolar administration. Plant Methods. 2015;11(1):1–7. doi: 10.1186/s13007-015-0061-y. - DOI - PMC - PubMed
-
- Kronzucker HJ, Siddiqi MY, Glass ADM. Conifer root discrimination against soil nitrate and the ecology of forest succession. Nature. 1997;385(6611):59–61. doi: 10.1038/385059a0. - DOI
LinkOut - more resources
Full Text Sources
Other Literature Sources
Miscellaneous
