. 2022 Jan;71(1):55-67.
doi: 10.1136/gutjnl-2020-323719. Epub 2021 Jan 19.

Activated intestinal muscle cells promote preadipocyte migration: a novel mechanism for creeping fat formation in Crohn's disease

Affiliations

Activated intestinal muscle cells promote preadipocyte migration: a novel mechanism for creeping fat formation in Crohn's disease

Ren Mao et al. Gut. 2022 Jan.

Abstract

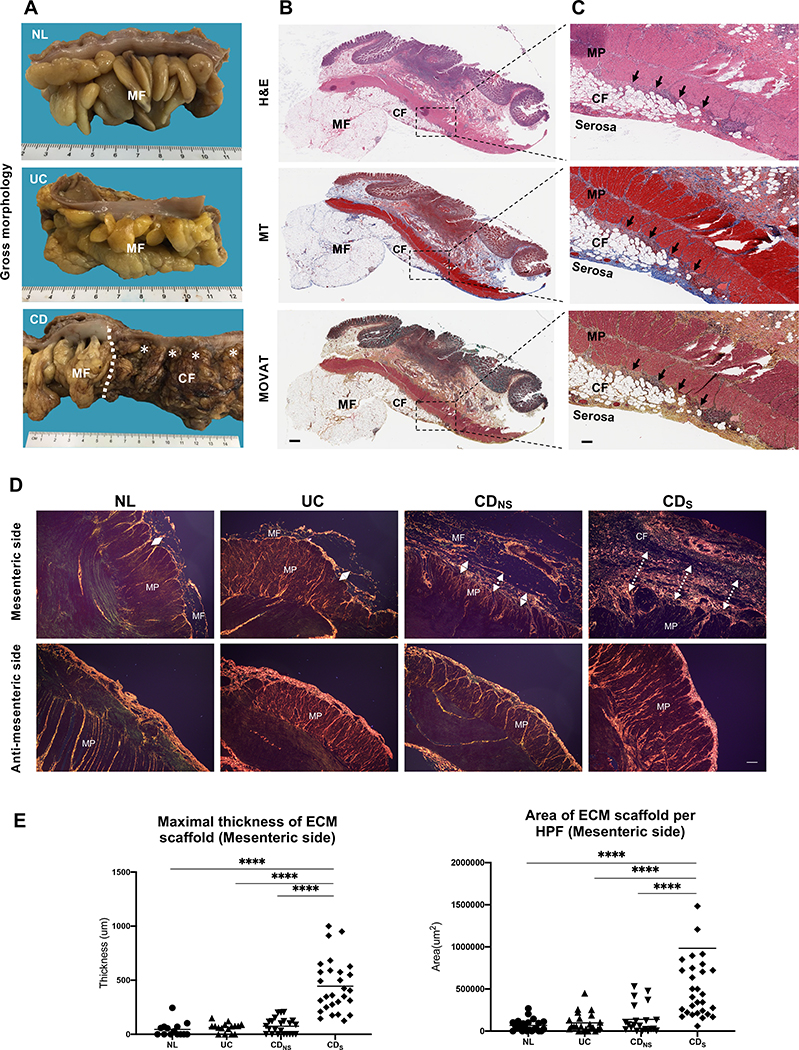
Objective: Creeping fat, the wrapping of mesenteric fat around the bowel wall, is a typical feature of Crohn's disease, and is associated with stricture formation and bowel obstruction. How creeping fat forms is unknown, and we interrogated potential mechanisms using novel intestinal tissue and cell interaction systems.

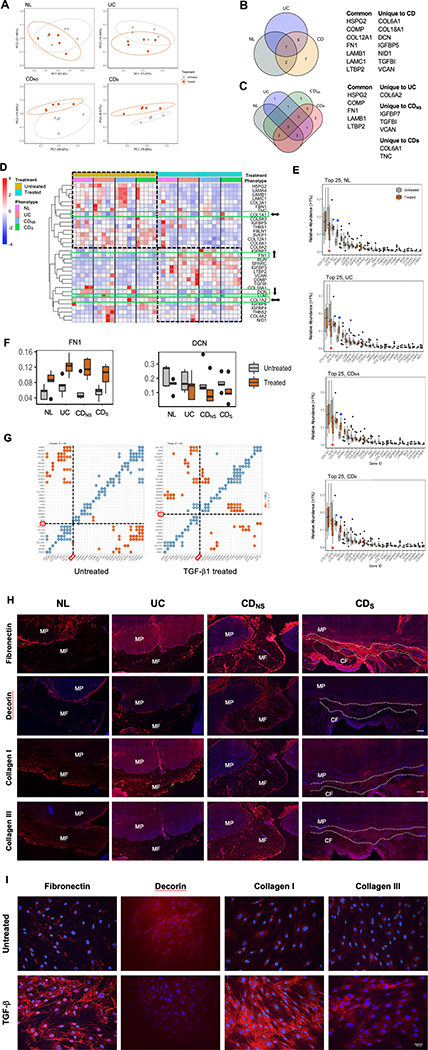
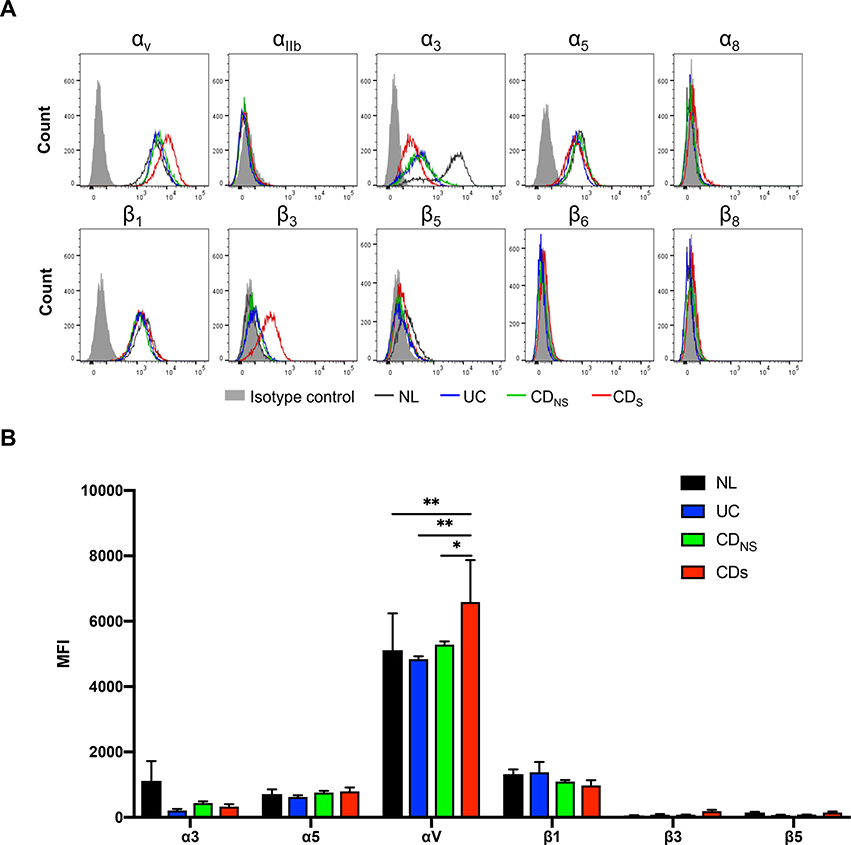
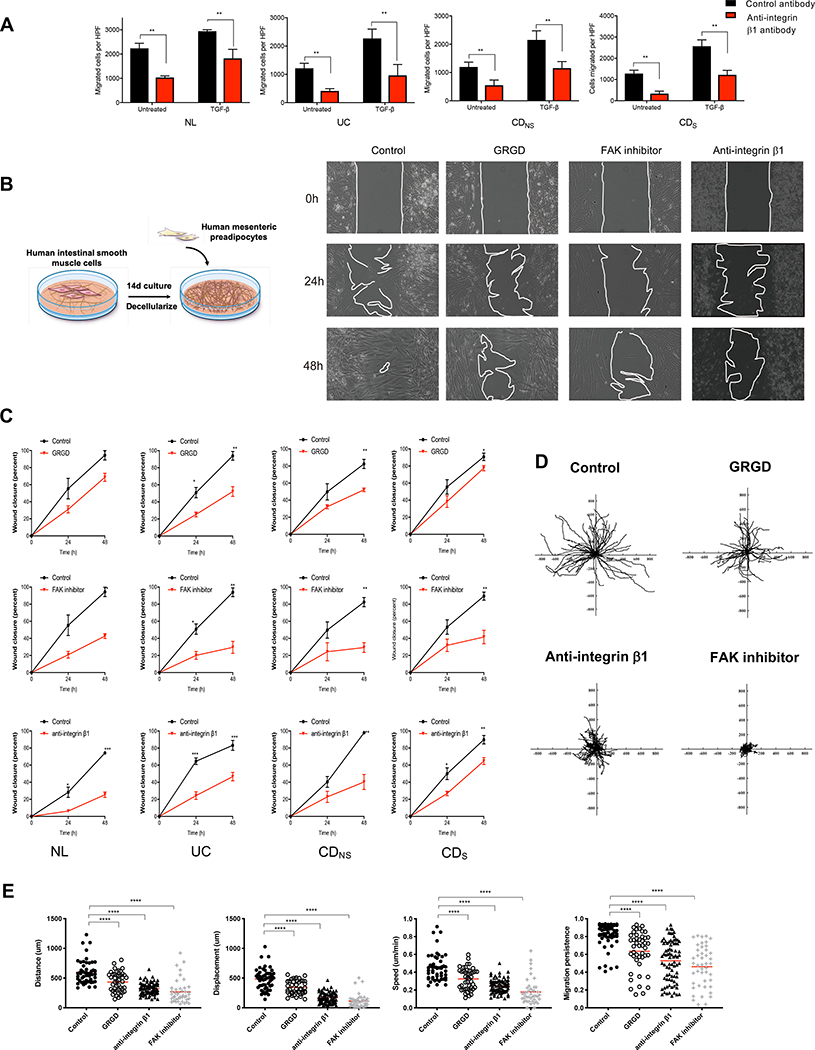
Design: Tissues from normal, UC, non-strictured and strictured Crohn's disease intestinal specimens were obtained. The muscularis propria matrisome was determined via proteomics. Mesenteric fat explants, primary human preadipocytes and adipocytes were used in multiple ex vivo and in vitro cell migration systems on muscularis propria muscle cell derived or native extracellular matrix. Functional experiments included integrin characterisation via flow cytometry and their inhibition with specific blocking antibodies and chemicals.

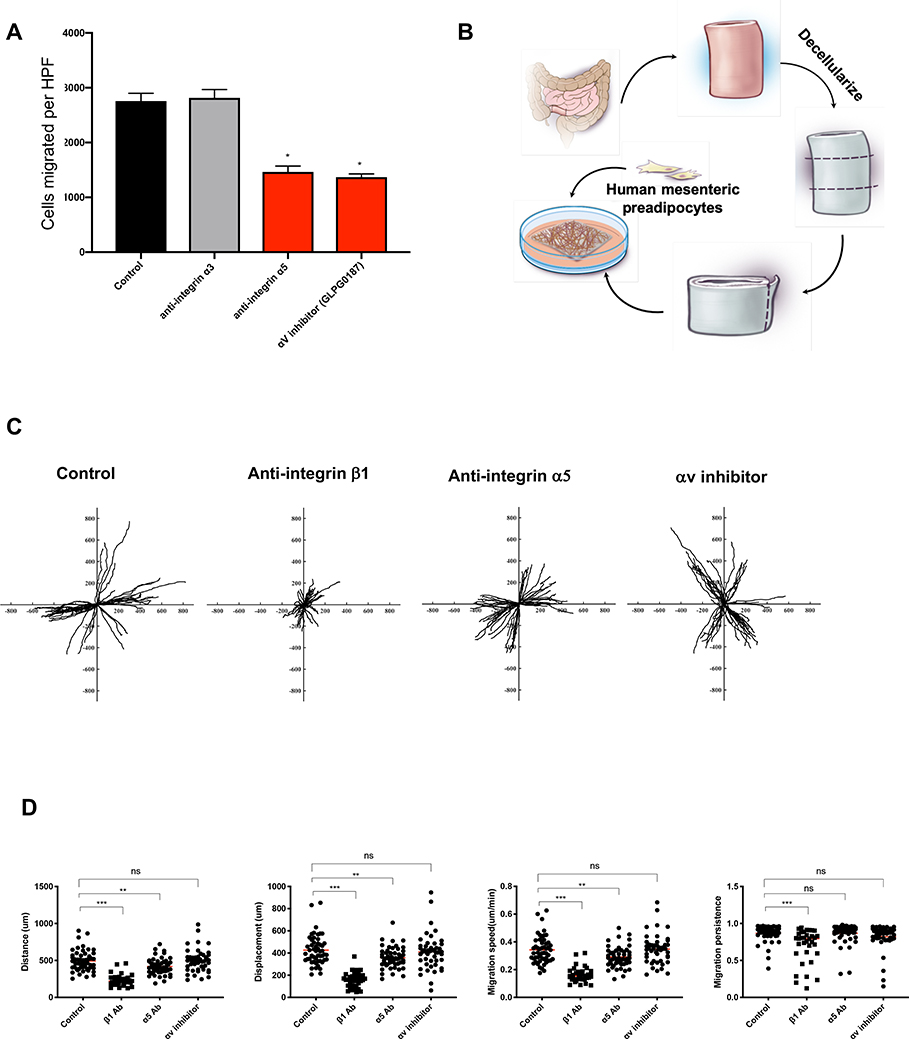
Results: Crohn's disease muscularis propria cells produced an extracellular matrix scaffold which is in direct spatial and functional contact with the immediately overlaid creeping fat. The scaffold contained multiple proteins, but only fibronectin production was singularly upregulated by transforming growth factor-β1. The muscle cell-derived matrix triggered migration of preadipocytes out of mesenteric fat, fibronectin being the dominant factor responsible for their migration. Blockade of α5β1 on the preadipocyte surface inhibited their migration out of mesenteric fat and on 3D decellularised intestinal tissue extracellular matrix.

Conclusion: Crohn's disease creeping fat appears to result from the migration of preadipocytes out of mesenteric fat and differentiation into adipocytes in response to an increased production of fibronectin by activated muscularis propria cells. These new mechanistic insights may lead to novel approaches for prevention of creeping fat-associated stricture formation.

Keywords: Crohn's disease; extracellular matrix; fibrosis.


Conflict of interest statement

Competing interests: FR is consultant to Agomab, Allergan, AbbVie, Boehringer-Ingelheim, Celgene, Cowen, Genentech, Gilead, Gossamer, Guidepoint, Helmsley, Index Pharma, Jannsen, Koutif, Metacrine, Morphic, Pfizer, Pliant, Prometheus Biosciences, Receptos, RedX, Roche, Samsung, Takeda, Techlab, Thetis, UCB and receives funding from the Crohn’s and Colitis Foundation of America, the Helmsley Charitable Trust, Kenneth Rainin Foundation and the National Institute of Health. CF received speaker fees from UCB, Genentech, Sandoz, Janssen and he is consultant for Athos Therapeutics.

Figures

Figure 1.
Figure 1.. Histopathology evaluation of human intestinal resections for creeping fat
(A) Gross pathology appearance of normal colon (NL) with mesenteric fat, ulcerative colitis (UC) with mesenteric fat (MF), Crohn’s disease (CD) with creeping fat (CF) on the right and normal MF on the left of the transition zone (dotted line). Pictures representative of n=7 in each group. (B) CD tissue with MF and subserosal CF stained with H&E, MT and MOVAT. Pictures representative of n=5 in each group. Magnification 3X. Scale bar: 1mm. (C) Closeup of panel B showing CF inter-positioned between the serosa and the MP in CD and a matrix scaffold (arrows) between the outer circular layer of the MP and CF (20X). Scale bar: 200μm. (D) Sirius red staining of the mesenteric and anti-mesenteric side of the colon showing a thicker ECM scaffold in CDS with CF compared to CDNS, UC and NL. Magnification 40X. Scale bar 100μm. (E) Thickness and area of the ECM scaffold are significantly increased in CDS compared to CDNS, UC and NL. One plot symbol represents one measurement in one patient. N=20–29 subjects per group. Abbreviations: CDNS, non-strictured CD; CDS, strictured CD; Mesenteric fat: MF; Creeping fat: CF; Muscularis propria: MP; H&E, hematoxylin & eosin; MT, Masson Trichrome: MT; MOVAT, Movat Pentachrome; ECM, extracellular matrix; HPF, high power field; ****= p<0.0001.
Figure 2.
Figure 2.. Mass spectrometry analysis of extracellular matrix proteins in supernatants from HIMC cultures of different phenotypes
(A) Principal components analysis of the relative abundance of matrisome proteins produced by NL, UC, CDNS and CDs; Ellipses indicate 95% confidence intervals. Separation of the matrisome components was noted in CDS between untreated and TGF-β1 exposure group. NL, UC, CDNS did not exhibit matrisome changes. (B and C) Significantly different ECM proteins produced by NL, UC, CDNS, and CDs HIMC exposed to TGF-β1. Proteins produced by treated and untreated HIMC were quantified and compared, and Venn diagrams were created using only the proteins that were significantly different between the treated and untreated groups among the four phenotypes. (B) seven proteins were produced by all HIMC, but seven were produced exclusively by CD HIMC, six were shared between CD and UC, and 2 between CD and NL. (C): when protein production by CD HIMC was analyzed based on the cell origin from non-strictured or strictured tissue, three were produced by non-strictured and two by strictured HIMC. (D) Unsupervised hierarchical clustering of ECM proteins (normalized relative abundance) produced by TGF-β-treated -untreated HIMC. Overall decreased and increased protein abundance was observed in most ECM proteins upon TGF-β exposure regardless of the NL, UC or CD phenotype of the cells. When the four most abundant ECM protein (Figure 2E) were individually analyzed (green rectangles), COL1A1 and COL1A2 remained essentially unchanged (⬌) regardless of cell phenotype, while FN1 clearly increased (⬆□) and DCN decreased (⬇□). (E) Top 25 ECM proteins produced by HIMC ranked by level of abundance and degree of change according to TGF-β-treated or -untreated status. While in all HIMC phenotypes COL1A1 and COL1A2 abundance remained essentially unchanged, FN1 was the most upregulated (red asterisk) and DCN the most downregulated (blue asterisk) ECM protein. (F) Box plots showing relative abundance of FN1 in TGF-β-treated and -untreated HIMC from the NL, UC, CDNS and CDs phenotypes. Levels of FN1 significantly increased in HIMC from all HIMC phenotypes, while levels of DCN were decreased (P ≤ .05 for all comparisons). (n=20) (G) Correlograms showing statistically significant correlations between ECM proteins in TGF-β-treated and -untreated HIMC from CDs (Spearman correlation, P ≤ .05). In untreated cells, FN1 was positively correlated with BGN and LTBP2, and negatively correlated with COL18A1, while in TGF-β–treated cells, FN1 was positively correlated with COL6A2 and COL6A3, and negatively correlated with COMP and COL4A2. Blue dots indicate positive correlation and brown dots indicate negative correlation. H) Representative immunofluorescence staining of fibronectin, collagen I, collagen III and decorin at the interface between muscularis propria and mesenteric fat in NL, UC and non-strictured CD and creeping fat in strictured CD tissues. NL, normal; UC, ulcerative colitis; CDNS, non-strictured Crohn’s disease; CDS, strictured Crohn’s disease; MF, mesenteric fat; CF, creeping fat; MP, muscularis propria. Scale bar: 200μm. Slides are representative of n=3 per group. (I) Immunofluorescence staining of fibronectin, collagen I, collagen III and decorin (red) and DAPI (blue) in TGF-β-treated and -untreated NL HIMC Scale bar: 100μm. Slides are representative of n=4 per group.
Figure 3.
Figure 3.. Human mesenteric fat ex vivo cell outgrowth model.
(A) Layout of human mesenteric fat ex vivo cell outgrowth on HIMC-derived ECM. (B) Representative images of cell outgrowth (arrows) from normal mesenteric fat tissue plated on plastic (left) or HIMC-derived ECM (right) (phase contrast images at day 5 of culture) (n=3 independent experiments with 4–6 fat pieces each). A representative video can be found in Supplemental Material (Video 1). (C) Differential, time-dependent outgrowth of cells outgrown from human mesenteric fat tissue plated on plastic alone (Matrix -) or HIMC-derived ECM (Matrix+). *P<0.05, ****P<0.001. (n=3 independent experiments with 4–6 fat pieces each). (D) Phenotype of human mesenteric fat-outgrown cells showing >99% positivity for CD90, CD73 and CD105, and no expression of CD34, CD11b, CD19, CD45 or HLA-DR. Flow cytometry results representative of 3–5 experiments. (E) Immunofluorescence staining for preadipocyte factor 1 (Pref-1), vimentin, CCAAT/enhancer-binding protein (CEBPα), fatty acid-binding protein 4 (FABP4), E-cadherin, VE-cadherin, desmin and α-SMA in cells outgrown from human mesenteric fat tissue. Figure representative of 3–5 experiments. Scalebar 100μm. (F) Acquisition of oil-red-O positivity by pre-adipocytes, but not human intestinal muscle cells (HIMC), upon differentiation into mature adipocytes after 14 days in culture. Figure representative of 3–5experiments. Scalebar 100μm.
Figure 4.
Figure 4.. Fibronectin in HIMC conditioned medium is responsible for pre-adipocyte migration
(A) Migration of pre-adipocytes in the Boyden chamber is significantly increased by conditioned medium of NL, UC, CDNS and CDS HIMC exposed to TGF-β1 but not to pro-inflammatory cytokines (IL-1β, TNF-α), growth factor (b-FGF) or PAMP ligands. *P<0.05. (n=4–6) (B) Filtration of HIMC conditioned medium through a 30, 100 and 300 KDa pore size significantly reduces migration of pre-adipocytes in the Boyden chamber. ****P<0.0001. (n=4–6) (C) Left: Fibronectin has the strongest effect on inducing migration of pre-adipocytes compared with other ECM proteins (Collagen I, collagen III, decorin), cytokines ((IL-1β, TNF-α), growth factor (b-FGF) and fatty acids (palmitate, stearate, oleate). Right: Fibronectin-induced migration of pre-adipocytes and adipocytes in a dose-dependent manner. (n=3–5) (D) Removal of fibronectin from HIMC-conditioned medium by immunoprecipitation significantly (**=P<0.01) reduces migration of pre-adipocytes in the Boyden chamber, while addition of soluble fibronectin to the fibronectin-depleted conditioned medium restores migration (E) Removal of fibronectin from HIMC by siRNA knockdown reduces migration of pre-adipocytes in the Boyden chamber (**=P<0.01) (F) Inhibition of HIMC-conditioned medium-induced pre-adipocyte migration in the Boyden chamber by GRGD and a focal adhesion kinase (FAK) inhibitor. (n=4–6) Abbreviations: Normal: NL; Ulcerative colitis: UC; Crohn’s disease: CD; CDNS: non-strictured; CDS: strictured; Fibronectin: FN; Collagen: Col; Immunoprecipitation: IP; Human intestinal muscularis propria smooth muscle cells: HIMC; Transforming growth factor: TGF
Figure 5.
Figure 5.. Integrin profiles of pre-adipocytes migrated out of mesenteric fat
(A) Flow cytometry analysis demonstrating that pre-adipocytes from CDS, CDNS, UC and NL expressed integrins α3, α5, αv and β1, but not α1, αIIb, α8, β3, β5, β6 and β8. (n=5) (B) Mean fluorescence intensity showing a higher expression of αv in CDS compared to NL, UC and CDNS. (n=5) NL, Normal; UC, ulcerative colitis; CD, Crohn’s disease; CDNS: non-strictured Crohn’s disease; CDS: strictured Crohn’s disease. MFI, mean fluorescence intensity. *P<0.05, **P<0.01.
Figure 6.
Figure 6.. Integrin β1 regulates pre-adipocyte migration on HIMC-derived extracellular matrix
(A) Blockade of integrin β1 significantly reduces migration of NL, UC, CDNS and CDS pre-adipocytes towards HIMC-conditioned medium in the Boyden chamber irrespective of the presence of TGF-β1. **P<0.01. (n=4–5) (B) Left: Layout of wound healing assay of pre-adipocyte migration on HIMC-derived ECM. Right: Representative phase contrast images of wound closure by pre-adipocyte migration at baseline, 24h and 48h, and effect of GRGD, FAK inhibition and integrin β1 blockade on migration. (n=4–5). (C) Wound closure was inhibited by GRGD, integrin β1 blocking antibody and FAK inhibitor for NL, UC, CDNS and CDS preadipocytes. (n=4–5). (D) Representative tracking of pre-adipocytes seeded on HIMC-derived ECM was performed for 24h in the absence (control) and presence of GRGD, integrin β1 blocking antibody and FAK inhibitor. (n=4–5). A representative video can be found in the supplement (Video 2). (E) Distance, displacement, velocity and migration persistence of pre-adipocyte migration on HIMC-derived ECM in untreated and following addition of GRGD, blocking antibodies to integrin β1 and FAK inhibitor. (n=4–5 with tracking n>50 cells per condition). NL, Normal; UC, ulcerative colitis; CD, Crohn’s disease; CDNS: non-strictured Crohn’s disease; CDS: strictured Crohn’s disease. Focal adhesion kinase: FAK; statistically significant data are indicated by *P<0.05, **P<0.01, ***P<0.001,****P<0.0001.
Figure 7.
Figure 7.. Integrin α5β1 regulates pre-adipocyte migration on the decellularized muscularis propria layer of human intestine.
(A) Integrin α5 blocking antibody and GLPG0187 (integrin αv antagonist) but not α3 blocking antibody reduced the migration of pre-adipocytes towards HIMC conditioned medium in the Boyden chamber. (n=5) (B) Schema of experimental set-up for the decellularized human intestinal muscularis propria experiments. (C) Representative tracking of pre-adipocytes seeded on decellularized human muscularis propria was performed for 24 h in the absence (control) and presence of integrin β1 blocking antibody, α5 blocking antibody, and GLPG0187 (integrin αv antagonist). Representative video can be found in the supplement (Video 3). (D) Distance, displacement, velocity and migration persistence of pre-adipocytes migration on decellularized human intestine with adding integrin β1 and α5 blocking antibody, and GLPG0187 (integrin αv antagonist). n=4 for decellularized muscularis propria. One symbol represents one tracked pre-adipocyte. Abbreviations: Antibody: Ab; Statistically significant data are indicated by *=P<0.05, **=P<0.01, ***=P<0.001.

References

    1. Cosnes J, Nion-Larmurier I, Beaugerie L, et al. Impact of the increasing use of immunosuppressants in Crohn’s disease on the need for intestinal surgery. Gut 2005;54:237–41. - PMC - PubMed
    1. Thia KT, Sandborn WJ, Harmsen WS, et al. Risk factors associated with progression to intestinal complications of Crohn’s disease in a population-based cohort. Gastroenterology 2010;139:1147–55. - PMC - PubMed
    1. Rocha VZ, Libby P. Obesity, inflammation, and atherosclerosis. Nat Rev Cardiol 2009;6:399–409. - PubMed
    1. Kredel LI, Siegmund B. Adipose-tissue and intestinal inflammation - visceral obesity and creeping fat. Front Immunol 2014;5:462. - PMC - PubMed
    1. Mao R, Kurada S, Gordon IO, et al. The Mesenteric Fat and Intestinal Muscle Interface: Creeping Fat Influencing Stricture Formation in Crohn’s Disease. Inflamm Bowel Dis 2019;25:421–6. - PubMed

Publication types