. 2021 Mar 3;41(9):2024-2038.
doi: 10.1523/JNEUROSCI.2507-20.2020. Epub 2021 Jan 19.

Disease Modeling with Human Neurons Reveals LMNB1 Dysregulation Underlying DYT1 Dystonia

Affiliations

Disease Modeling with Human Neurons Reveals LMNB1 Dysregulation Underlying DYT1 Dystonia

Baojin Ding et al. J Neurosci. .

Abstract

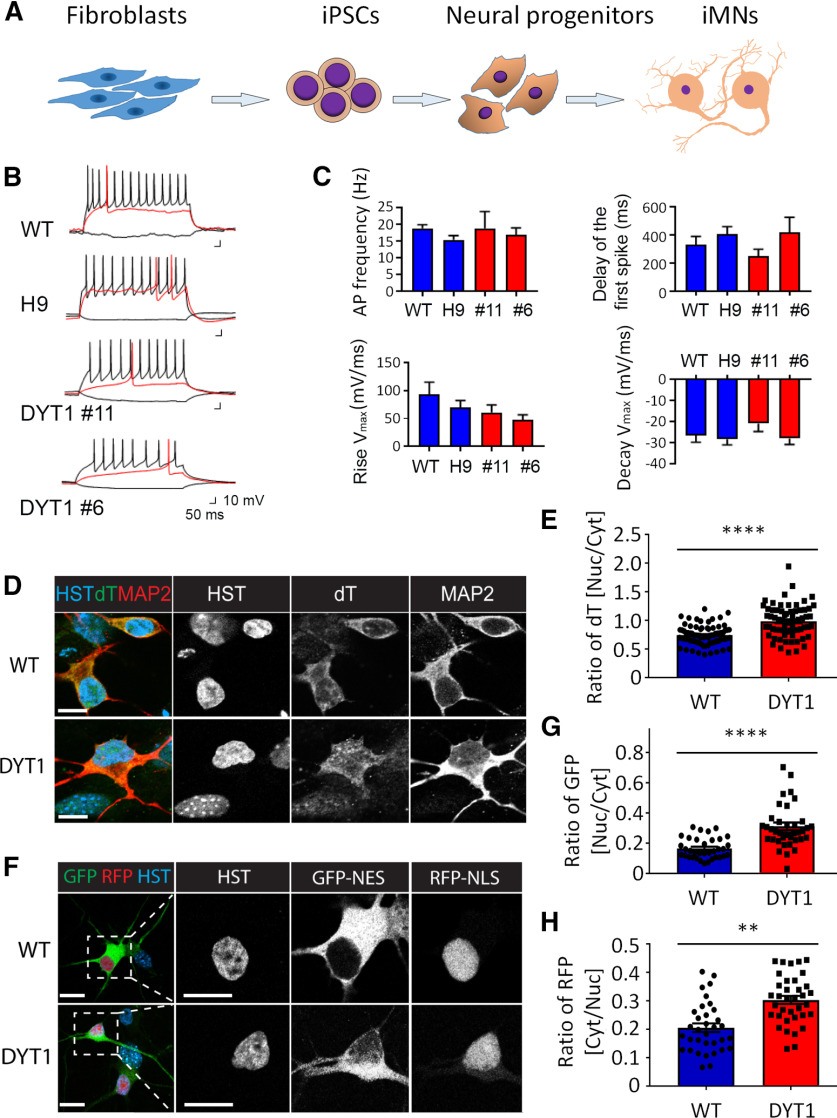
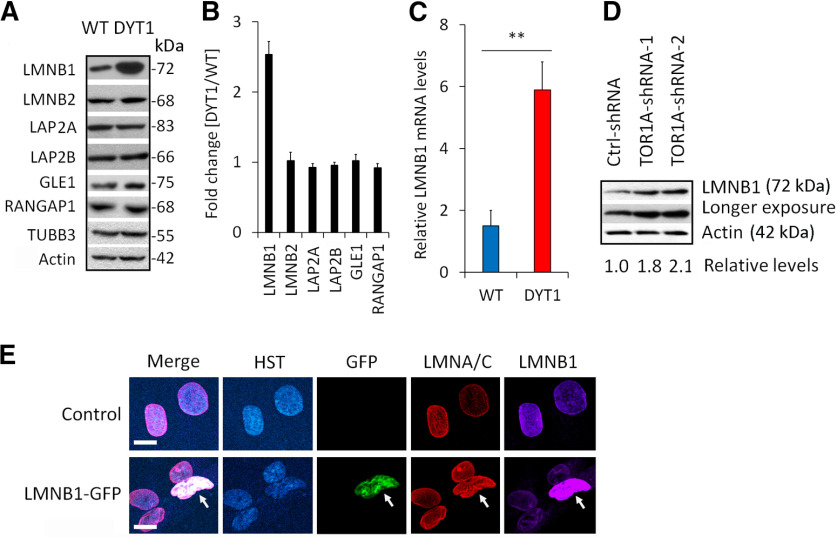
DYT1 dystonia is a hereditary neurologic movement disorder characterized by uncontrollable muscle contractions. It is caused by a heterozygous mutation in Torsin A (TOR1A), a gene encoding a membrane-embedded ATPase. While animal models provide insights into disease mechanisms, significant species-dependent differences exist since animals with the identical heterozygous mutation fail to show pathology. Here, we model DYT1 by using human patient-specific cholinergic motor neurons (MNs) that are generated through either direct conversion of patients' skin fibroblasts or differentiation of induced pluripotent stem cells (iPSCs). These human MNs with the heterozygous TOR1A mutation show reduced neurite length and branches, markedly thickened nuclear lamina, disrupted nuclear morphology, and impaired nucleocytoplasmic transport (NCT) of mRNAs and proteins, whereas they lack the perinuclear "blebs" that are often observed in animal models. Furthermore, we uncover that the nuclear lamina protein LMNB1 is upregulated in DYT1 cells and exhibits abnormal subcellular distribution in a cholinergic MNs-specific manner. Such dysregulation of LMNB1 can be recapitulated by either ectopic expression of the mutant TOR1A gene or shRNA-mediated downregulation of endogenous TOR1A in healthy control MNs. Interestingly, downregulation of LMNB1 can largely ameliorate all the cellular defects in DYT1 MNs. These results reveal the value of disease modeling with human patient-specific neurons and indicate that dysregulation of LMNB1, a crucial component of the nuclear lamina, may constitute a major molecular mechanism underlying DYT1 pathology.SIGNIFICANCE STATEMENT Inaccessibility to patient neurons greatly impedes our understanding of the pathologic mechanisms for dystonia. In this study, we employ reprogrammed human patient-specific motor neurons (MNs) to model DYT1, the most severe hereditary form of dystonia. Our results reveal disease-dependent deficits in nuclear morphology and nucleocytoplasmic transport (NCT). Most importantly, we further identify LMNB1 dysregulation as a major contributor to these deficits, uncovering a new pathologic mechanism for DYT1 dystonia.

Keywords: TOR1A; cholinergic motor neurons; dystonia; human neurons; nuclear LMNB1; nucleocytoplasmic transport.


Figures

Figure 1.
Figure 1.
Direct conversion of DYT1 patient fibroblasts to MNs. A, A schematic of the direct conversion procedure. B, A lower magnification view of the reprogrammed neurons at 19 d postviral infection (dpi). Virus-transduced cells are indicated by the co-expressed GFP. Scale bar: 50 µm. C, Confocal images of the reprogrammed neurons at 19 dpi. Higher magnification views of nuclear HB9 are shown in the bottom panels. Scale bar: 20 µm. D, Quantification of the reprogramming efficiency (n = 259 for Ctrl-1, n = 249 for Ctrl-2, n = 237 for Ctrl-3, n = 243 for Ctrl-4, n = 257 for DYT1-1, n = 254 for DYT1-2, n = 302 for DYT1-3, and n = 257 for DYT1-4 from triplicates; ns, not significant). E, Fractions of diMNs among the reprogrammed neurons (n = 257 for Ctrl-1, n = 273 for Ctrl-2, n = 252 for Ctrl-3, n = 281 for Ctrl-4, n = 229 for DYT1-1, n = 219 for DYT1-2, n = 289 for DYT1-3, and n = 233 for DYT1-4 from triplicates; ns, not significant). F, Robust expression of the MN marker ChAT at 7 wpi. Arrowheads indicate ChAT+ puncta. Scale bar: 20 µm. G, Expression of the presynaptic marker SYN1 at 9 wpi. The inset shows discrete SYN1+ puncta (indicated by arrow heads). Scale bar: 50 µm. H, Quantitative analysis of neurite length at 2 wpi (n = 123 for Ctrl-1, n = 126 for Ctrl-2, n = 137 for Ctrl-3, n = 125 for Ctrl-4, n = 114 for DYT1-1, n = 127 for DYT1-2, n = 118 for DYT1-3, n = 113 for DYT1-4 from triplicates; ns, not significant; ****p = 2.56E-05, t test). I, Neurite number of the primary branches examined at 4 wpi (n = 163 for Ctrl-1, n = 153 for Ctrl-2, n = 157 for Ctrl-3, n = 145 for Ctrl-4, n = 152 for DYT1-1, and n = 143 for DYT1-2, n = 125 for DYT1-3, and n = 131 for DYT1-4 from triplicates; ns, not significant; ***p = 0.00032, t test). J, A time course analysis of diMN survival [each line n (neurons) > 2000 from triplicates; ns, not significant].
Figure 2.
Figure 2.
Impaired NCT in DYT1-diMNs from fibroblasts. A, RNase A-treated diMNs as negative controls for FISH. Cells were analyzed at 6 wpi. Scale bar: 20 µm. B, Oligo-dA probes as negative controls for FISH assays at 6 wpi. Scale bar: 20 µm. C, FISH analysis of diMNs with oligo-dT probes at 6 wpi. Scale bar: 20 µm. D, Quantification of oligo-dT signal distribution (n = 65 for Ctrl-1, n = 67 for Ctrl-2, n = 72 for Ctrl-3, n = 70 for Ctrl-4, n = 64 for DYT1-1, n = 63 for DYT1-2, n = 74 for DYT1-3, and n = 68 for DYT1-4 from four replicates; ns, not significant; ****p = 3.83E-08, t test). E, A dual reporter system for measuring protein NCT. NES, nuclear export signal; NLS, nuclear localization signal. F, Representative confocal images of reporter distribution in diMNs at 6 wpi. Scale bar: 20 µm. G, Subcellular distribution of GFP-NES in diMNs (n = 62 for Ctrl-1, n = 64 for Ctrl-2, n = 76 for Ctrl-3, n = 74 for Ctrl-4, n = 67 for DYT1-1, and n = 68 for DYT1-2 n = 75 for DYT1-3, and n = 73 for DYT1-4 from four replicates; ns, not significant; ****p = 5.15E-10, t test). H, Subcellular distribution of RFP-NLS in diMNs (n = 62 for Ctrl-1, n = 64 for Ctrl-2, n = 76 for Ctrl-3, n = 74 for Ctrl-4, n = 67 for DYT1-1, and n = 68 for DYT1-2 n = 75 for DYT1-3, and n = 73 for DYT1-4 from four replicates; ns, not significant; ****p = 4.15E-12, t test).
Figure 3.
Figure 3.
NCT impairments in DYT1-iMNs from iPSCs. A, A schematic of the iPSC-based procedure to generate iMNs. B, Repetitive AP waveforms recorded under current-clamp mode for the control (WT and H9) and two clones of DYT1 iMNs (#11 and #6) at 5 wpi. The precondition sweep and the sweep immediately above threshold (in red) are also shown. C, Quantifications of AP frequency, delay of the first spike, rise and delay Vmax in the indicated iMNs, respectively (n = 30 for each line from 4 biological replicates). D, Representative confocal images of FISH assay in iMNs at 3 wpi. Scale bar: 10 µm. E, Subcellular distribution of mRNAs in iMNs by FISH assay (n = 85 for WT and 73 for DYT1 from triplicates; ****p = 7.13E-05, t test). F, Representative confocal images of iMNs with the dual reporter at 3 wpi. Scale bar: 20 µm. G, Subcellular distribution of GFP-NES in iMNs (n = 34 for WT and n = 36 for DYT1 from triplicates; ****p = 3.42E-06, t test). H, Subcellular distribution of RFP-NLS in iMNs (n = 34 for WT and n = 36 for DYT1 from triplicates; **p = 0.0043, t test).
Figure 4.
Figure 4.
NE deformation in DYT1-iMNs. A, Representative electron micrograph of WT-iPSC. A higher magnification view of the boxed region is shown in A1 of the bottom panel. N, nucleus; C, cytoplasm; INM, inner nuclear membrane; ONM, outer nuclear membrane; Mi, mitochondria. Scale bars: 1 µm. B, Representative electron micrograph of DYT1-iPSC. A higher magnification view of the boxed region is shown in B1 of the bottom panel. Scale bars: 1 µm. C, Representative electron micrographs of WT-iMN at 3 wpi. Higher magnification views of the boxed regions are shown in C1, C2, respectively. NPC, nuclear pore complex. Scale bars: 1 µm. D–G, Representative electron micrographs of DYT1-iMNs at 3 wpi. Higher magnification views of the boxed regions are shown in G1, G2, G3, respectively. Scale bars: 1 µm. H, iMNs with abnormal nuclear morphology at 3 wpi [n (nuclei) = 47 for WT and 42 for DYT1 from triplicates; ****p = 4.31E-05, t test]. I, Ratio of electron dense area immediately beneath the nuclear membrane to the nuclear perimeter in iMNs at 3 wpi [n (nuclei) = 24 for WT and 22 for DYT1 from triplicates; ****p = 2.15E-05, t test]. J, Nuclear pore size in iMNs at 3 wpi [n (nuclei/nuclear pore) = 17/56 for WT and 21/34 for DYT1 from triplicates; ns, not significant, t test]. K, Number of nuclear pore structure in iMNs at 3 wpi [n (nuclei) = 35 for WT and 32 for DYT1 from triplicates; ***p = 0.000263, t test].
Figure 5.
Figure 5.
Abnormal nuclear morphology and mislocalized LMNB1 in DYT1-diMNs. A, Representative confocal images of diMNs at 4 wpi. Arrowheads indicate the sharp and rigid angles in nuclear membrane. Scale bar: 50 µm. B, Quantification of diMNs with abnormal nuclear morphology at 4 wpi (n > 100 for each line from four replicates; ns, not significant; ****p = 2.38E-09, t test). C, Representative confocal images of diMNs at 6 wpi. Scale bar: 20 µm. D, Percentages of diMNs with mislocalized LMNB1 at 6 wpi (n = 410 for Ctrl-1, n = 418 for Ctrl-2, n = 490 for Ctrl-3, n = 378 for Ctrl-4, n = 358 for DYT1-1, n = 349 for DYT1-2, n = 378 for DYT1-3, and n = 376 for DYT1-4 from four replicates; ns, not significant; ****p = 6.43E-11, t test). E, Representative confocal images of diMNs at 6 wpi. Scale bar: 50 µm. F, A time course analysis of LMNB1 mislocalization in DYT1-diMNs. Scale bar: 50 µm. G, Frequency of LMNB1 mislocalization in DYT1-diMNs at the indicated time points (n = 458 for 3 wpi, n = 425 for 4 wpi, n = 327 for 5 wpi, n = 314 for 6 wpi, and n = 213 for 7 wpi from triplicates; ns, not significant; compare to 3 wpi, **p < 0.01, ***p < 0.001, ****p < 0.0001, ANOVA). H, Subcellular distribution of LMNB1 (neurite vs nucleus) in DYT1-diMNs at the indicated time points (n = 126 for 3 wpi, n = 114 for 4 wpi, n = 128 for 5 wpi, and n = 107 for 6 wpi from triplicates; ns, not significant; ***p < 0.001, ****p < 0.0001, ANOVA or t test).
Figure 6.
Figure 6.
LMNB1-specific mislocalization in DYT1-iMNs. A, Representative confocal images of the indicated markers in iMNs at 3 wpi. Scale bar: 20 µm. B, Subcellular localization of LMNB1 in iMNs at 3 wpi (n = 397 for WT and n = 423 for DYT1 from triplicates; ****p = 2.42E-06, t test). C–E, Representative confocal images of the indicated markers in iMNs at 3 wpi. Scale bars: 10 µm.
Figure 7.
Figure 7.
TOR1A hypoactivity disrupts NCT and LMNB1 localization in a MN-specific manner. A, Protein expression of the ectopically expressed TOR1A WT or ΔE in iMNs; Actin serves as a loading control. B, The effect of TOR1A expression on mRNA distribution assayed by FISH in iMNs at 3 wpi (n = 99 for WT and n = 78 for DYT1 from triplicates; ****p = 5.44E-05, t test). C, Quantification of LMNB1 mislocalization in iMNs at 3 wpi (n = 82 for WT and n = 75 for DYT1 from triplicates; ****p = 2.48E-06, t test). D, Representative confocal images of iMNs with ectopic (GFP+) TOR1A WT or ΔE at 3 wpi. Scale bar: 50 µm. E, Western blots showing shRNA knock-down of TOR1A protein expression in iMNs. F, qRT-PCR showing downregulation of TOR1A mRNA by shRNAs (n = 3; ****p = 6.58E-05, ANOVA). G, The effect of TOR1A downregulation on mRNA subcellular distribution assayed by FISH in iMNs at 3 wpi (n = 95 for Ctrl, n = 87 for TOR1A-shRNA-1, and n = 78 for TOR1A-shRNA-2 from triplicates; **p = 0.00327, ANOVA). H, Representative confocal images of iMNs with the indicated shRNAs (mCherry+) at 3 wpi. Scale bar: 25 µm. I, The effect of TOR1A downregulation on LMNB1 subcellular distribution in iMNs. ShRNA lentiviruses were added at either predifferentiation (neural progenitors) or postdifferentiation (MNs at 5 dpi) stages; n (pre and post) = 126 and 113 for Ctrl, n = 118 and 97 for TOR1A-shRNA-1, and n = 103 and 94 for TOR1A-shRNA-2 from triplicates; ****p = 4.08E-10 (Ctrl vs shRNA-1) and 5.78E-9 (Ctrl vs shRNA-2), t test. J, Representative confocal images of DYT1-iPSC spontaneously differentiated non-MNs at 3 wpi. Scale bar: 100 µm. K, Representative confocal images of SY5Y-derived non-MNs with ectopic expression of TOR1AΔE (GFP+) at 4 wpi. Scale bar: 50 µm.
Figure 8.
Figure 8.
Specific upregulation of LMNB1 in DYT1 MNs. A, Western blottings for the indicated proteins in WT-iMNs and DYT1-iMNs at 11 dpi. TUBB3 and Actin are loading controls. B, Fold changes (DYT1 to WT) of the indicated proteins in A after normalization to the loading control (n = 3). C, Relative LMNB1 mRNA levels analyzed by qRT-PCR in iMNs at 11 dpi (n = 3; **p = 0.0092, t test). D, Western blottings for LMNB1 expression (shorter and longer exposure) in iMNs with the indicated shRNAs at 11 wpi. Actin serves as a loading control. Values at the bottom indicate the relative LMNB1 protein levels. E, Confocal micrographs of fibroblasts with or without overexpression of LMNB1 (fused with GFP). Arrow indicates a cell with LMNB1 overexpression. Scale bars: 10 µm.
Figure 9.
Figure 9.
Phenotypic amelioration of DYT1 MNs via LMNB1 downregulation. A, Western blottings showing shRNA-mediated downregulation of LMNB1. The single band of LMNB1 on the whole blotting membrane indicates the specificity of LMNB1 antibody. Actin serves as a loading control. B, Representative confocal images of iMNs with the indicated shRNAs (mCherry+) at 3 wpi. Scale bar: 25 µm. C, Percentage of iMNs (mCherry+) with mislocalized LMNB1 in B [n (neurons) > 200 for each condition from triplicates; ns, not significant; *p = 0.032, ****p < 0.0001, ANOVA]. D, Quantitative analysis of neurite length of iMNs (mCherry+) at 2 wpi under the indicated conditions [n (neurons) > 100 for each sample from triplicates; ns, not significant; **p = 0.0074, ***p = 0.00017 (vs DYT1-Ctrl), ANOVA; ****p = 1.26E-05 (WT-Ctrl vs DYT1-Ctrl), t test]. E, Neurite number of the primary branches in iMNs (mCherry+) at 4 wpi [n (neurons) > 100 each sample from triplicates; ns, not significant; ***p < 0.00043, ****p = 7.42E-05 (vs DYT1-Ctrl), ANOVA; ****p = 2.833E-15 (WT-Ctrl vs DYT1-Ctrl), t test]. F, Percentage of DYT1-iMNs with abnormal nuclear morphology at 3 wpi (n = 104 for DYT1, n = 98 for Ctrl-shNRA, n = 72 for LMNB1-shRNA1 and n = 69 for LMNB1-shNRA2 from triplicates; ns, not significant; ****p = 5.34E-08, ANOVA). G, Representative confocal images of FISH assay of iMNs at 3 wpi. shRNA-expressing cells are identified by the co-expressed mCherry. Dotted lines highlight nuclei. Scale bar: 10 µm. H, Quantification of oligo-dT signal distribution in G [n (neurons) > 100 for each sample from triplicates; ns, not significant; ***p = 0.00063, ANOVA; ****p = 5.34E-09 (WT-Ctrl vs DYT1-Ctrl), t test]. I, A working model for DYT1 pathogenesis. The healthy MNs have normal nuclear morphology and NCT activity. In DYT1 MNs, LMNB1 upregulation leads to thickened nuclear lamina, cytoplasmic localization, abnormal nuclear morphology, and impaired NCT, which may subsequently lead to mislocalization of mRNAs and proteins and dysfunction of neurons.

Similar articles

Cited by

References

    1. Albanese A, Bhatia K, Bressman SB, Delong MR, Fahn S, Fung VS, Hallett M, Jankovic J, Jinnah HA, Klein C, Lang AE, Mink JW, Teller JK (2013) Phenomenology and classification of dystonia: a consensus update. Mov Disord 28:863–873. 10.1002/mds.25475 - DOI - PMC - PubMed
    1. Arber S, Han B, Mendelsohn M, Smith M, Jessell TM, Sockanathan S (1999) Requirement for the homeobox gene Hb9 in the consolidation of motor neuron identity. Neuron 23:659–674. 10.1016/s0896-6273(01)80026-x - DOI - PubMed
    1. Beck M, Hurt E (2017) The nuclear pore complex: understanding its function through structural insight. Nat Rev Mol Cell Biol 18:73–89. 10.1038/nrm.2016.147 - DOI - PubMed
    1. Broers JL, Ramaekers FC, Bonne G, Yaou RB, Hutchison CJ (2006) Nuclear lamins: laminopathies and their role in premature ageing. Physiol Rev 86:967–1008. 10.1152/physrev.00047.2005 - DOI - PubMed
    1. Burke B, Stewart CL (2013) The nuclear lamins: flexibility in function. Nat Rev Mol Cell Biol 14:13–24. 10.1038/nrm3488 - DOI - PubMed

Publication types

MeSH terms

Supplementary concepts