

Experienced well-being rises with income, even above $75,000 per year
- PMID: 33468644
- PMCID: PMC7848527
- DOI: 10.1073/pnas.2016976118
Experienced well-being rises with income, even above $75,000 per year
Abstract
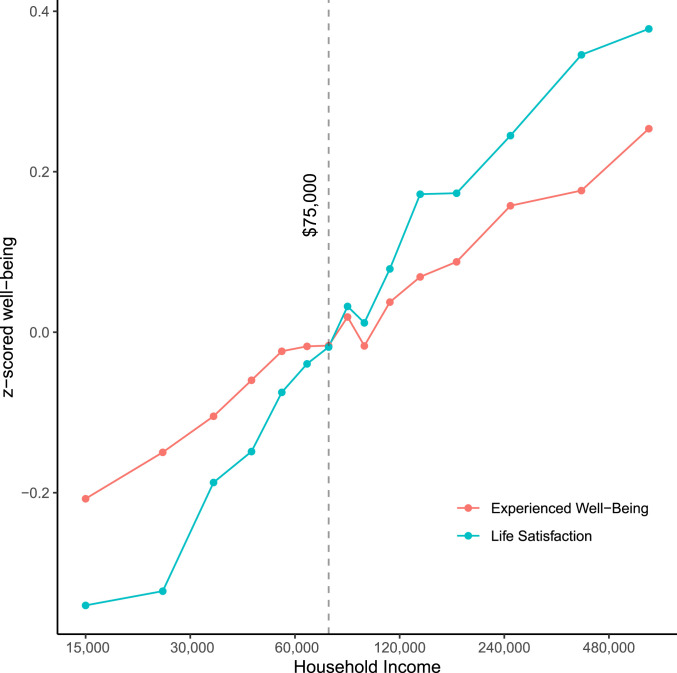
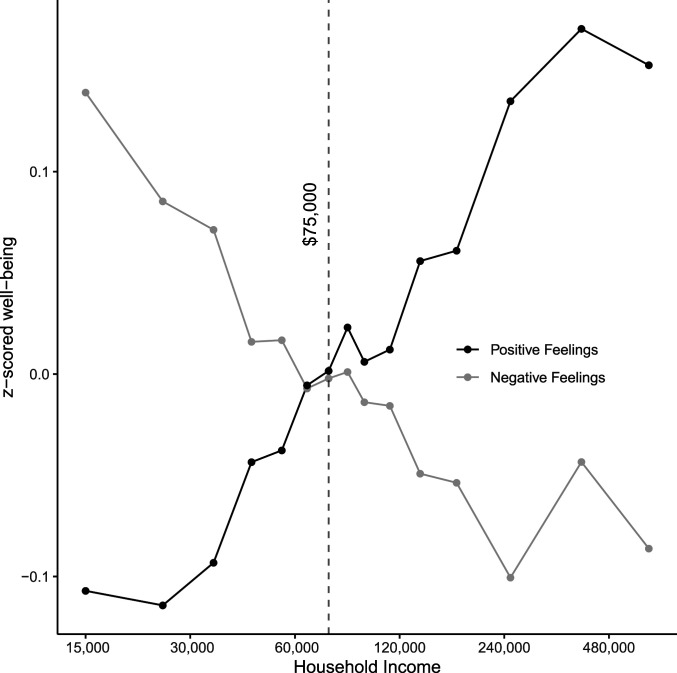
What is the relationship between money and well-being? Research distinguishes between two forms of well-being: people's feelings during the moments of life (experienced well-being) and people's evaluation of their lives when they pause and reflect (evaluative well-being). Drawing on 1,725,994 experience-sampling reports from 33,391 employed US adults, the present results show that both experienced and evaluative well-being increased linearly with log(income), with an equally steep slope for higher earners as for lower earners. There was no evidence for an experienced well-being plateau above $75,000/y, contrary to some influential past research. There was also no evidence of an income threshold at which experienced and evaluative well-being diverged, suggesting that higher incomes are associated with both feeling better day-to-day and being more satisfied with life overall.
Keywords: experience sampling; happiness; income; satiation; well-being.
Copyright © 2020 the Author(s). Published by PNAS.
Conflict of interest statement
The authors declare no competing interest.
Figures
Similar articles
-
Income and emotional well-being: A conflict resolved.Proc Natl Acad Sci U S A. 2023 Mar 7;120(10):e2208661120. doi: 10.1073/pnas.2208661120. Epub 2023 Mar 1. Proc Natl Acad Sci U S A. 2023. PMID: 36857342 Free PMC article.
-
Money Does Not Always Buy Happiness, but Are Richer People Less Happy in Their Daily Lives? It Depends on How You Analyze Income.Front Psychol. 2022 May 31;13:883137. doi: 10.3389/fpsyg.2022.883137. eCollection 2022. Front Psychol. 2022. PMID: 35719460 Free PMC article.
-
Happiness, income satiation and turning points around the world.Nat Hum Behav. 2018 Jan;2(1):33-38. doi: 10.1038/s41562-017-0277-0. Epub 2018 Jan 8. Nat Hum Behav. 2018. PMID: 30980059
-
The new stylized facts about income and subjective well-being.Emotion. 2012 Dec;12(6):1181-7. doi: 10.1037/a0029873. Emotion. 2012. PMID: 23231724 Review.
-
The psychological consequence of thinking about time in terms of money.Curr Opin Psychol. 2019 Apr;26:103-105. doi: 10.1016/j.copsyc.2018.12.018. Epub 2019 Jan 2. Curr Opin Psychol. 2019. PMID: 30685640 Review.
Cited by
-
High life satisfaction reported among small-scale societies with low incomes.Proc Natl Acad Sci U S A. 2024 Feb 13;121(7):e2311703121. doi: 10.1073/pnas.2311703121. Epub 2024 Feb 5. Proc Natl Acad Sci U S A. 2024. PMID: 38315863 Free PMC article.
-
The scientific value of numerical measures of human feelings.Proc Natl Acad Sci U S A. 2022 Oct 18;119(42):e2210412119. doi: 10.1073/pnas.2210412119. Epub 2022 Oct 3. Proc Natl Acad Sci U S A. 2022. PMID: 36191179 Free PMC article.
-
Les Misérables: An analysis of low SWB across the world.Front Psychol. 2023 Jun 8;14:1107939. doi: 10.3389/fpsyg.2023.1107939. eCollection 2023. Front Psychol. 2023. PMID: 37359886 Free PMC article.
-
Reply to Rohrer and Wenz and Arslan: The association between income and emotional well-being.Proc Natl Acad Sci U S A. 2024 Nov 12;121(46):e2322160121. doi: 10.1073/pnas.2322160121. Epub 2024 Oct 31. Proc Natl Acad Sci U S A. 2024. PMID: 39480842 Free PMC article. No abstract available.
-
Job Mobility and Subjective Well-Being among New-Generation Migrant Workers in China: The Mediating Role of Interpersonal Trust.Int J Environ Res Public Health. 2022 Sep 14;19(18):11551. doi: 10.3390/ijerph191811551. Int J Environ Res Public Health. 2022. PMID: 36141822 Free PMC article.
References
-
- Diener E., Biswas-Diener R., Will money increase subjective well-being? Soc. Indic. Res. 57, 119–169 (2002).
-
- Gardner J., Oswald A. J., Money and mental wellbeing: A longitudinal study of medium-sized lottery wins. J. Health Econ. 26, 49–60 (2007). - PubMed
-
- Argyle M., “Causes and correlates of happiness” in Well-Being: The Foundations of Hedonic Psychology, Kahneman D., Diener E., Schwarz N., Eds. (Russell Sage Foundation, 1999), pp. 353–373.
-
- Stevenson B., Wolfers J., Economic growth and subjective well-being: Reassessing the Easterlin paradox. Brookings Pap. Econ. Act. 2008, 1–87 (2008).
-
- Veenhoven R., Hagerty M., Rising happiness in nations 1946–2004: A reply to Easterlin. Soc. Indic. Res. 79, 421–436 (2006).
LinkOut - more resources
Full Text Sources
Other Literature Sources
Miscellaneous
