. 2021 Jan 26;118(4):e2017218118.
doi: 10.1073/pnas.2017218118.

Discrete TrkB-expressing neurons of the dorsomedial hypothalamus regulate feeding and thermogenesis

Affiliations

Discrete TrkB-expressing neurons of the dorsomedial hypothalamus regulate feeding and thermogenesis

Jessica Houtz et al. Proc Natl Acad Sci U S A. .

Abstract

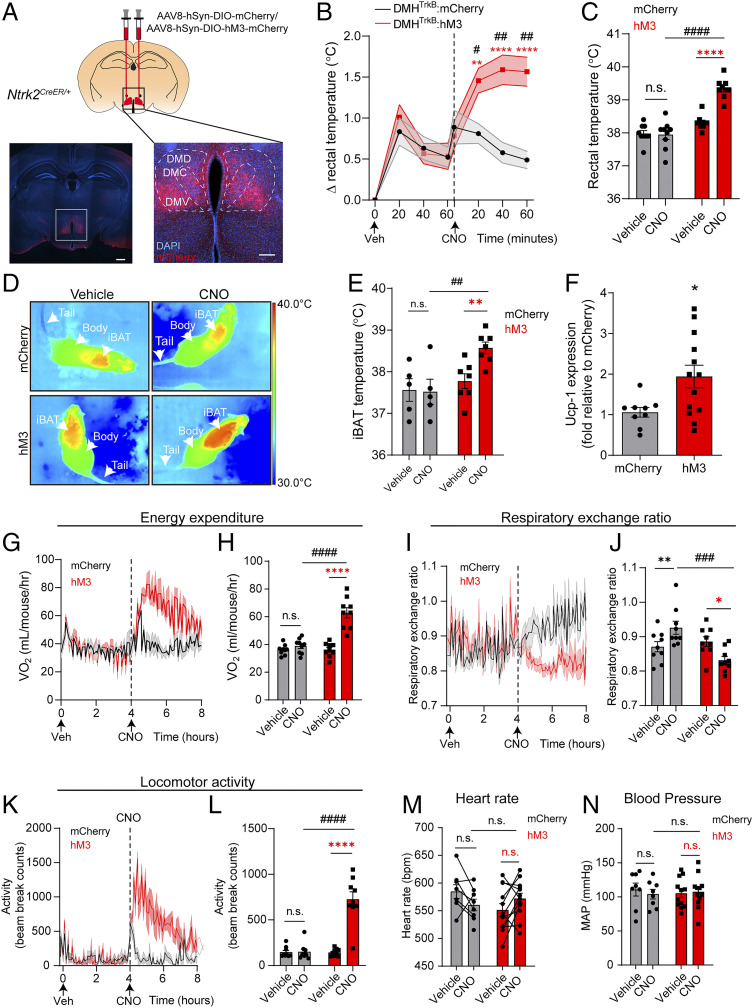
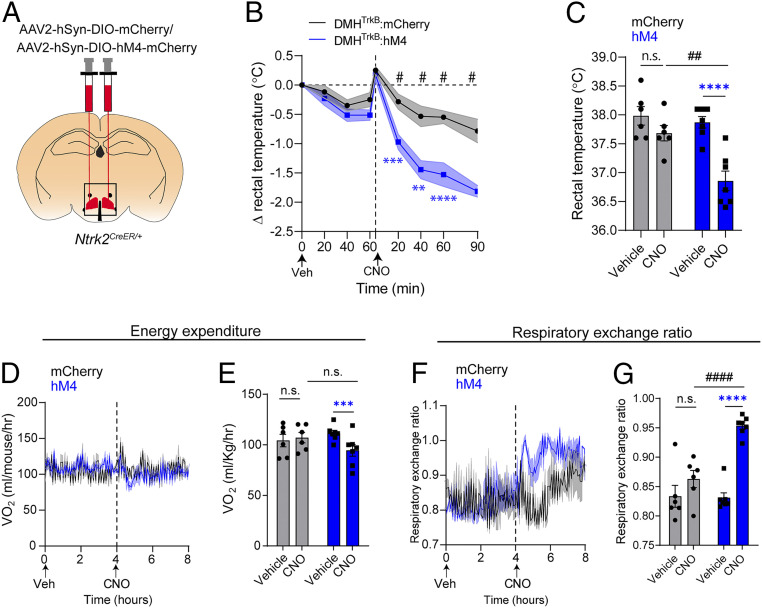
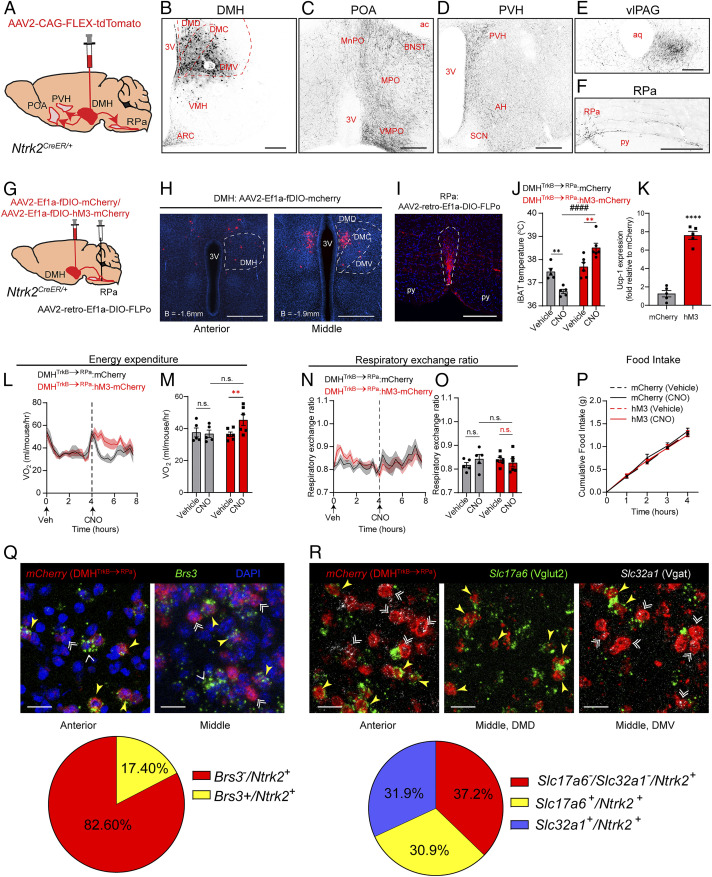
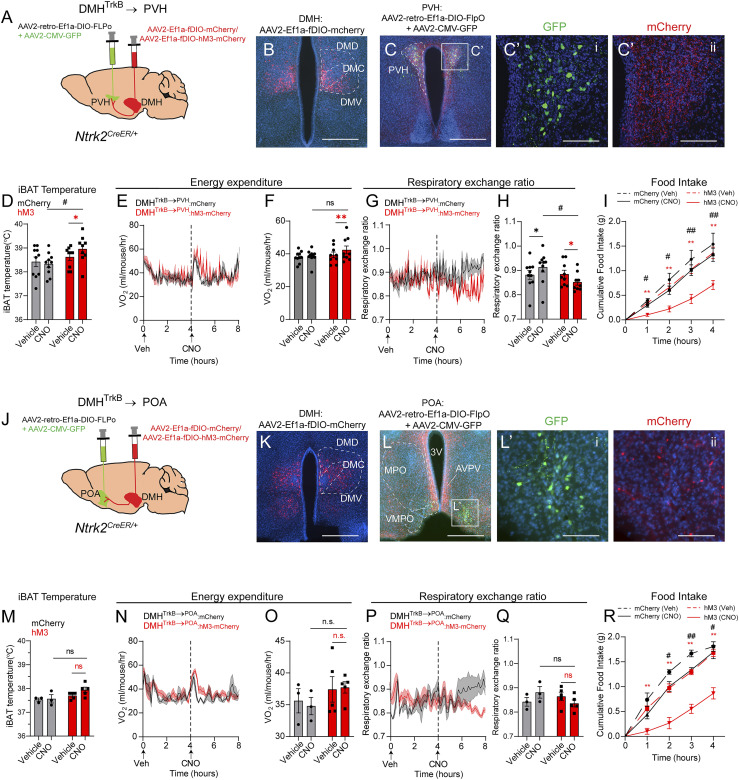
Mutations in the TrkB neurotrophin receptor lead to profound obesity in humans, and expression of TrkB in the dorsomedial hypothalamus (DMH) is critical for maintaining energy homeostasis. However, the functional implications of TrkB-fexpressing neurons in the DMH (DMHTrkB) on energy expenditure are unclear. Additionally, the neurocircuitry underlying the effect of DMHTrkB neurons on energy homeostasis has not been explored. In this study, we show that activation of DMHTrkB neurons leads to a robust increase in adaptive thermogenesis and energy expenditure without altering heart rate or blood pressure, while silencing DMHTrkB neurons impairs thermogenesis. Furthermore, we reveal neuroanatomically and functionally distinct populations of DMHTrkB neurons that regulate food intake or thermogenesis. Activation of DMHTrkB neurons projecting to the raphe pallidus (RPa) stimulates thermogenesis and increased energy expenditure, whereas DMHTrkB neurons that send collaterals to the paraventricular hypothalamus (PVH) and preoptic area (POA) inhibit feeding. Together, our findings provide evidence that DMHTrkB neuronal activity plays an important role in regulating energy expenditure and delineate distinct neurocircuits that underly the separate effects of DMHTrkB neuronal activity on food intake and thermogenesis.

Keywords: TrkB; dorsomedial hypothalamus; energy expenditure; feeding; neurocircuitry.


Conflict of interest statement

The authors declare no competing interest.

Figures

Fig. 1.
Fig. 1.
DMHTrkB neurons are sensitive to changes in environmental temperature. Representative images of Fos staining (green) in the DMH of Ntrk2CreER/+;Ai9 reporter mice after exposure for 2 h to (AA”) thermoneutral (30 °C), (BB”) warm (39 °C), or (CC”) cold (10 °C) temperatures. tdTomato (red) marks TrkB-expressing cells in reporter mice. (Scale bars, 250 µm; inset scale bars, 50 µm.) (D) Quantification of Fos induction in TrkB-expressing neurons in the anterior (Ant), middle (Mid), and posterior (Pos) DMH after mice were exposed to different temperatures. Two-way ANOVA: temperature, F(2, 9) = 18.68; P = 0.0006; n = 4 mice per condition; Dunnett’s posttest versus neutral; n.s. = not significant, *P < 0.05, **P < 0.01, and ***P < 0.001. Values represent mean ± SEM. DMH, dorsomedial hypothalamus; DMD, DMH dorsal division; DMC, DMH central division; DMV, DMH ventral division; VMH, ventromedial hypothalamus; ARC, arcuate nucleus; B, bregma.
Fig. 2.
Fig. 2.
DMHTrkB neuronal activity drives negative energy balance. (A) Schematic of bilateral stereotactic delivery of AAV expressing Cre-dependent hM3-mCherry (AAV8-hSyn-DIO-hM3-mCherry) or mCherry (AAV8-hSyn-DIO-mCherry) into the DMH of Ntrk2CreER/+ mice. Low-magnification scale bar, 500 µm; high-magnification scale bar, 200 µm. Mice housed at thermoneutrality expressing either mCherry (gray, n = 9) or hM3-mCherry (red, n = 9) in DMHTrkB neurons were treated with Veh or CNO during the light cycle. (B) Rectal temperature. Two-way RM ANOVA: mCherry versus hM3, F(1, 16) = 10.11, and P = 0.0058. (C) Average rectal temperatures 60 min after treatment. Two-way RM ANOVA: mCherry versus hM3, F(1, 16) = 36.55, and P < 0.0001. (D) Representative thermal images. (E) iBAT temperature of mice housed at thermoneutrality expressing mCherry (n = 5) or hM3 (n = 7) in DMHTrkB neurons 60 min postinjection with either vehicle or CNO. Two-way RM ANOVA: mCherry versus hM3, F(1, 10) = 6.350, and P = 0.0304. (F) Levels of Ucp1 mRNA in iBAT from mice expressing hM3 or mCherry in DMHTrkB neurons 2 h following treatment with CNO (n= 9 mCherry and n= 13 hM3; unpaired, two-tailed t test, and P = 0.0207). (G) Oxygen consumption (VO2) over 4 h after treatment with Veh (0 to 4 h) and CNO (4 to 8 h). Mixed-effects model: mCherry versus hM3 (post-CNO), F(1, 16) = 26.89, and P < 0.0001. (H) VO2 for the duration of the first 4 h after treatment. Two-way RM ANOVA: mCherry versus hM3, F(1, 16) = 17.64, and P = 0.0007. (I) RER over 4 h following treatment. Mixed-effects model: mCherry versus hM3 expression (post-CNO), F(1, 16) = 16.65, and P = 0.0009. (J) Average RER for the duration of the first 4 h after treatment. Two-way RM ANOVA: mCherry versus hM3 expression, F(1, 16) = 5.072, and P = 0.0387. (K) Locomotor activity over 4 h after treatment. Mixed-effects model: mCherry versus hM3 (post-CNO), F(1, 16) = 39.78, and P < 0.0001. (L) Average locomotor activity for the duration of the first 4 h after treatment. Two-way RM ANOVA: mCherry versus hM3, F(1, 16) = 30.86, and P < 0.0001. (M and N) Heart rate and mean arterial pressure (MAP) in mice expressing mCherry or hM3 in DMHTrkB neurons 1 h after vehicle or CNO treatment. Two-way RM ANOVA for heart rate: mCherry versus hM3 expression, F(1, 18) = 0.6447, and P = 0.4325. Two-way RM ANOVA for MAP: mCherry versus hM3 expression, F(1, 18) = 0. 01210, and P = 0.9136. n = 8 mCherry mice and 12 hM3 mice. Values represent mean ± SEM. (B, C, E, and GN) Sidak posttest (red * for hM3-Veh versus hM3-CNO, black * for mCherry-Veh versus mCherry-CNO, and # for mCherry versus hM3 post-CNO: n.s. = not significant; * and #, P < 0.05; ** and ##, P < 0.01; *** and ###, P < 0.001; **** and ####, P < 0.0001).
Fig. 3.
Fig. 3.
DMHTrkB neurons are necessary for cold-induced thermogenesis. (A) Schematic of bilateral stereotactic delivery of AAV expressing Cre-dependent inhibitory hM4-mCherry (AAV2-hSyn-DIO-hM4-mCherry) or mCherry (AAV2-hSyn-DIO-mCherry) into the DMH of Ntrk2CreER/+. (BG) Mice housed at 10 °C expressing either mCherry (gray, n = 6) or hM4-mCherry (blue, n = 7) in DMHTrkB neurons were treated with vehicle (Veh) or CNO during the light cycle. (B) Rectal temperature of mice following treatment with Veh (0 to 60 min) or CNO (0 to 90 min). Two-way RM ANOVA: mCherry versus hM4, F(1, 11) = 20.40, and P = 0.0009. (C) Average rectal temperatures 60 min after treatment. Two-way RM ANOVA: mCherry versus hM4, F(1, 11) = 7.577, and P = 0.0188. (D) Oxygen consumption over 4 h after treatment. Mixed-effects model: mCherry versus hM4 expression (post-CNO), F(1, 11) = 3.066, and P = 0.1078. (E) Average VO2 for the duration of the first 4 h after treatment. Two-way RM ANOVA: mCherry versus hM4 expression, F(1, 11) = 0.1502, and P = 0.7058). (F) RER over 4 h after treatment. Mixed-effects model: mCherry versus hM4 (post-CNO), F(1, 11) = 39.28, and P < 0.0001. (G) RER for the duration of the first 4 h after treatment. Two-way RM ANOVA: mCherry versus hM4, F(1, 11) = 8.633, and P = 0.0135. Values represent mean ± SEM (BG). Sidak posttest (blue * for hM4-Veh versus hM4-CNO, black * for mCherry-Veh versus mCherry-CNO, and # for mCherry versus hM4 post-CNO: n.s. = not significant; #P < 0.05; ** and ##, P < 0.01; ***P < 0.001; **** and ####, P < 0.0001).
Fig. 4.
Fig. 4.
A DMHTrkB → RPa neurocircuit regulates energy expenditure and body temperature. (A) Diagram of anterograde tracing of DMHTrkB neurons in Ntrk2CreER/+ mice unilaterally injected with AAV2-CAG-FLEX-TdTomato. (B) Injection site. (CF) Projection targets: (C) POA including the median preoptic area, MPO, and VMPO and the BNST; (D) PVH and AH; (E) vlPAG; and (F) RPa. (Scale bars, 200 µm.) (G) Schematic of stereotactic delivery of retrograde AAV expressing Cre-dependent FLPo (AAV2-retro-Ef1a-DIO-FLPo) and AAV2-CMV-GFP to the RPa, and FLP-dependent (fDIO) mCherry or hM3-mCherry expressing virus to the DMH in Ntrk2CreER/+ mice. (H) Expression of mCherry (red) in DMHTrkB→RPa neurons. (Scale bar, 500 µm.) (I) mCherry-labeled DMHTrkB→RPa terminals are detected in the RPa (outlined). (Scale bar, 200 µm.) (JO) Mice housed at thermoneutrality and expressing hM3-mCherry (red, n = 6) or mCherry (gray, n = 5) in DMHTrkB→RPa neurons were treated with Veh or CNO during the light cycle. (J) BAT temperature 60 min after Veh or CNO treatment. Two-way RM ANOVA: mCherry versus hM3, F(1, 9) = 29.24, and P = 0.0004. (K) Relative levels of Ucp1 mRNA in BAT 2 h post-CNO treatment. Unpaired, two-tailed t test, P < 0.0001. (L) Oxygen consumption after treatment. Two-way RM ANOVA: mCherry versus hM3 (post-CNO), F(1, 9) = 4.695, and P = 0.0584. (M) Average oxygen consumption for the duration of the first 4 h after treatment. Two-way RM ANOVA: mCherry versus hM3, F(1, 9) = 1.227, and P = 0.2967. (N) RER after treatment with vehicle or CNO. Two-way RM ANOVA: mCherry versus hM3 (post-CNO), F(1, 9) = 0.2985, and P = 0.5985. (O) Average RER for the duration of the first 4 h after treatment. Two-way RM ANOVA: mCherry versus hM3, F(1, 9) = 0.03257, and P = 0.8608. (P) Nocturnal food intake of mice expressing mCherry or hM3 in DMHTrkB→RPa neurons after treatment with vehicle or CNO. Two-way RM ANOVA: mCherry versus hM3, F(1, 16) = 0.02664, and P = 0.8724. (Q) Detection of Brs3 (green) and mCherry (red) expression by ISH in the anterior (Left) and middle (Right) DMH of DMHTrkB→RPa:mCherry expressing mice. Yellow arrowheads indicate Brs3+ DMHTrkB→RPa neurons. White double arrowheads indicate Brs3 DMHTrkB→RPa neurons. Single white arrowheads indicate Brs3+ mCherry. (Scale bars, 20 µm.) (R) In situ detection of Slc17a6 (Vglut2, green) and Slc32a1 (Vgat, white) in the anterior and middle-dorsal and middle-ventral DMH of DMHTrkB→RPa:mCherry mice. Yellow arrowheads indicate Vglut+ DMHTrkB→RPa neurons. Double white arrowheads indicate Vgat+ DMHTrkB→RPa neurons. (Scale bars, 20 µm.) (Q and R) Representative images are from n = 3 animals. Values represent mean ± SEM. Sidak posttest (red * for hM3-Veh versus hM3-CNO, black * for mCherry-Veh versus mCherry-CNO, and # for mCherry versus hM3 post CNO; n.s. = not significant; **P < 0.01; **** and ####, P < 0.0001). 3V, third ventricle; ac, anterior commissure; py, pyramid; SCN, suprachiasmatic nucleus.
Fig. 5.
Fig. 5.
DMHTrkB neurons project to the PVH and POA to regulate feeding and metabolism. (A) Strategy for projection-specific targeting of mCherry or hM3-mCherry expression in DMHTrkB neurons. Retrograde AAV expressing Cre-dependent FLPo (AAV2-retro-Ef1a-DIO-FLPo) and AAV-GFP are delivered to the PVH, while Flp-dependent mCherry or hM3-mCherry–expressing virus is injected into the DMH in Ntrk2CreER/+ mice. (B) Expression of mCherry in DMHTrkB→PVH neurons. (Scale bar, 500 µm.) (C and C’) Expression of GFP marking the injection site of retrograde AAV2-retro-Ef1a-DIO-FLPo in the PVH (C’, i) and mCherry in axonal terminals of DMHTrkB neurons in the PVH (C’, ii). Scale bars, 500 µm in B and 100 µm in C. (DH) Mice housed at thermoneutrality and expressing mCherry (gray, n = 10) or hM3-mCherry (red, n = 9) in DMHTrkB→PVH neurons were treated with Veh and then CNO during the light cycle. (D) iBAT temperature. Two-way RM ANOVA: mCherry versus hM3, F(1, 17) = 3.178, and P = 0.0925. (E) Oxygen consumption. Mixed-effects model: mCherry versus hM3 (post-CNO), F(1, 17) = 0.4561, and P = 0.5085. (F) Average oxygen consumption for the duration of 4 h following treatment. Two-way RM ANOVA: mCherry versus hM3, F(1, 17) = 1.252, and P = 0.2787. (G) RER. Mixed-effects model: mCherry versus hM3 (post-CNO), F(1, 17) = 5.311, and P = 0.0341. (H) Average RER for the duration of 4 h following treatment. Two-way RM ANOVA: mCherry versus hM3, F(1, 17) = 1.614, and P = 0.008168. (I) Nocturnal food intake of mice expressing mCherry or hM3 in DMHTrkB→PVH neurons postinjection of vehicle or CNO. Two-way RM ANOVA: mCherry versus hM3, F(1, 17) = 4.913, and P = 0.0406. (J) Schematic for projection-specific targeting of DMHTrkB→POA neurons. (K) Expression of mCherry in DMHTrkB→POA neurons. (Scale bar, 500 µm.) (L and L’) Expression of GFP marking the injection site of AAV2-retro-Ef1a-DIO-FLPo in the POA and mCherry in axonal terminals of DMHTrkB neurons in the POA. (Scale bars, 500 µm in L and 100 µm in L’. (MO) Mice housed at thermoneutrality and expressing mCherry (gray, n = 3) or hM3-mCherry (red, n = 5) in DMHTrkB→POA neurons were treated with Veh and then CNO during the light cycle. (M) iBAT temperature. Two-way RM ANOVA: mCherry versus hM3, F(1, 6) = 5.031, and P = 0.0661. (N) Oxygen consumption. Two-way RM ANOVA: mCherry versus hM3 (post-CNO), F(1, 6) = 3.557, and P = 0.1083. (O) Average oxygen consumption for the duration of 4 h following treatment. Two-way RM ANOVA: mCherry versus hM3, F(1, 6) = 1.475, and P = 0.2701). (P) RER. Two-way RM ANOVA: mCherry versus hM3 (post-CNO), F(1, 6) = 2.985, and P = 0.1348. (Q) Average respiratory ratio for the duration of 4 h following treatment. Two-way RM ANOVA; mCherry versus hM3, F(1, 6) = 0.2390, and P = 0.6423. (R) Nocturnal food intake of mice expressing mCherry or hM3 in DMHTrkB→POA neurons. Two-way RM ANOVA: mCherry versus hM3, F(1, 6) = 24.98, and P = 0.0025. Values represent mean ± SEM. Sidak posttest (* for Veh versus CNO, # for mCherry versus hM3; * and #, P < 0.05; ** and ##, P < 0.01; n.s. = not significant).

Similar articles

Cited by

References

    1. Hruby A., Hu F. B., The epidemiology of obesity: A big picture. Pharmacoeconomics 33, 673–689 (2015). - PMC - PubMed
    1. Leibel R. L., Rosenbaum M., Hirsch J., Changes in energy expenditure resulting from altered body weight. N. Engl. J. Med. 332, 621–628 (1995). - PubMed
    1. Lotfi K., Palmer K., Apovian C. M., Case Study: Weight loss in a patient with type 2 diabetes: Challenges of diabetes management. Obesity (Silver Spring) 23 (suppl. 1), S11–S12 (2015). - PubMed
    1. Chen K. Y., et al. , Opportunities and challenges in the therapeutic activation of human energy expenditure and thermogenesis to manage obesity. J. Biol. Chem. 295, 1926–1942 (2020). - PMC - PubMed
    1. Kalil G. Z., Haynes W. G., Sympathetic nervous system in obesity-related hypertension: mechanisms and clinical implications. Hypertens. Res. 35, 4–16 (2012). - PMC - PubMed

Publication types

MeSH terms

LinkOut - more resources