. 2021 Jan 26;118(4):e2019314118.
doi: 10.1073/pnas.2019314118.

Synaptotagmin-1-, Munc18-1-, and Munc13-1-dependent liposome fusion with a few neuronal SNAREs

Affiliations

Synaptotagmin-1-, Munc18-1-, and Munc13-1-dependent liposome fusion with a few neuronal SNAREs

Karolina P Stepien et al. Proc Natl Acad Sci U S A. .

Abstract

Neurotransmitter release is governed by eight central proteins among other factors: the neuronal SNAREs syntaxin-1, synaptobrevin, and SNAP-25, which form a tight SNARE complex that brings the synaptic vesicle and plasma membranes together; NSF and SNAPs, which disassemble SNARE complexes; Munc18-1 and Munc13-1, which organize SNARE complex assembly; and the Ca2+ sensor synaptotagmin-1. Reconstitution experiments revealed that Munc18-1, Munc13-1, NSF, and α-SNAP can mediate Ca2+-dependent liposome fusion between synaptobrevin liposomes and syntaxin-1-SNAP-25 liposomes, but high fusion efficiency due to uncontrolled SNARE complex assembly did not allow investigation of the role of synaptotagmin-1 on fusion. Here, we show that decreasing the synaptobrevin-to-lipid ratio in the corresponding liposomes to very low levels leads to inefficient fusion and that synaptotagmin-1 strongly stimulates fusion under these conditions. Such stimulation depends on Ca2+ binding to the two C2 domains of synaptotagmin-1. We also show that anchoring SNAP-25 on the syntaxin-1 liposomes dramatically enhances fusion. Moreover, we uncover a synergy between synaptotagmin-1 and membrane anchoring of SNAP-25, which allows efficient Ca2+-dependent fusion between liposomes bearing very low synaptobrevin densities and liposomes containing very low syntaxin-1 densities. Thus, liposome fusion in our assays is achieved with a few SNARE complexes in a manner that requires Munc18-1 and Munc13-1 and that depends on Ca2+ binding to synaptotagmin-1, all of which are fundamental features of neurotransmitter release in neurons.

Keywords: membrane fusion; neurotransmitter release; reconstitution; synaptic vesicle fusion; synaptotagmin-1.


Conflict of interest statement

The authors declare no competing interest.

Figures

Fig. 1.
Fig. 1.
Syt1 strongly stimulates liposome fusion at very low synaptobrevin-to-lipid ratios. (A) Diagram summarizing the content mixing assays used to test if Syt1 stimulates liposome fusion. V-liposomes containing synaptobrevin (red) or VSyt1-liposomes containing synaptobrevin and Syt1 (blue) are mixed with T-liposomes that contain syntaxin-1 (yellow) and SNAP-25 (green) and that have been preincubated with Munc18-1, NSF, and α-SNAP. Ca2+ is added after 300 s. The V- or VSyt1-liposomes contain trapped Cy5-strepatavidin (navy blue pie shape with red circle) and the T-liposomes contain trapped PhycoE-biotin (yellow square with pink triangle). Content mixing resulting from liposome fusion results in formation of a complex between Cy5-streptavidin and PhycoE-biotin, leading to an increase in Cy5 fluorescence emission intensity upon excitation of PhycoE due to FRET. Unlabeled streptavidin (not shown) is included outside the vesicles to ensure that the content mixing signal does not arise from leakiness. (B) Content mixing between V- or VSyt1-liposomes and T-liposomes was monitored from the increase in the fluorescence signal of Cy5-streptavidin trapped in the V- or VSyt1-liposomes caused by FRET with PhycoE-biotin trapped in the T-liposomes upon liposome fusion. The synaptobrevin-to-lipid ratio in V- and VSyt1-liposomes (V 10K and VSyt1 10K, respectively) was 1:10,000, the Syt1-to-lipid ratio in VSyt1-liposomes was 1:1,000, and the syntaxin-1–to–lipid ratio in the T-liposomes was 1:800 (T 0.8K). The assays were performed in the presence of 1 µM Munc18-1, 0.2 µM Munc13-1C, 0.4 µM NSF, 2 µM α-SNAP, 5 µM excess SNAP-25, and 5 μM streptavidin, except for the controls where Munc18-1 or Munc13-1C was omitted (no Munc18-1 or no Munc13-1C, respectively), as indicated by the color-coded labels. Experiments were started in the presence of 100 μM EGTA, and Ca2+ (600 μM) was added at 300 s. (C) Analogous content mixing assays monitoring fusion of T-liposomes with V-liposomes or VSyt1-liposomes containing WT Syt1 or Syt1 bearing mutations in the Ca2+-binding sites of the C2A domain (VSyt1-C2A* 10K), the C2B domain (VSyt1-C2B* 10K), or both (VSyt1-C2A*B* 10K). (D) Quantification of the content mixing assays shown in C. Bars represent averages of the normalized fluorescence intensities observed in the content mixing assays at 300 s (i.e., before Ca2+ addition) and at 600 s (i.e., 300 s after Ca2+ addition), performed in triplicates. Error bars represent SDs. Statistical significance and P values were determined by one-way ANOVA with the Holm–Sidak test (***P < 0.001).
Fig. 2.
Fig. 2.
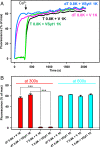
Membrane anchoring of SNAP-25 dramatically enhances liposome fusion. (A) Content mixing between V- or VSyt1-liposomes (V 1K or VSyt1 1K, respectively) and T- or dT-liposomes (T 0.8K or dT 0.8K, respectively) was monitored from the increase in the fluorescence signal of Cy5-streptavidin trapped in the V- or VSyt1-liposomes caused by FRET with PhycoE-biotin trapped in the T- or dT-liposomes upon liposome fusion. The synaptobrevin-to-lipid ratio in V- and VSyt1-liposomes was 1:1,000, the Syt1-to-lipid ratio in VSyt1-liposomes was 1:1,000, the syntaxin-1–to–lipid ratio in the T- and dT-liposomes was 1:800, and the dSNAP-25–to–lipid ratio in the dT-liposomes was 1:800. The assays were performed in the presence of 1 µM Munc18-1, 0.2 µM Munc13-1C, 0.4 µM NSF, 2 µM α-SNAP, 5 µM excess SNAP-25 (only for experiments performed with T-liposomes), and 5 μM streptavidin. Experiments were started in the presence of 100 μM EGTA, and Ca2+ (600 μM) was added at 300 s. (B) Quantification of the content mixing assays shown in A. Bars represent averages of the normalized fluorescence intensities observed in the content mixing assays at 300 s (i.e., before Ca2+ addition) and at 600 s (i.e., 300 s after Ca2+ addition), performed in triplicates. Error bars represent SDs. Statistical significance and P values were determined by one-way ANOVA with the Holm–Sidak test (***P < 0.001).
Fig. 3.
Fig. 3.
Enhancement of liposome fusion by membrane anchoring of SNAP-25 at different synaptobrevin and syntaxin-1 densities. (A, C, and E) Content mixing between VSyt1-liposomes and T- or dT-liposomes was monitored from the increase in the fluorescence signal of Cy5-streptavidin trapped in the VSyt1-liposomes caused by FRET with PhycoE-biotin trapped in the T- or dT-liposomes upon liposome fusion. In the VSyt1-liposomes, the Syt1-to-lipid ratio was 1:1,000 and the synaptobrevin-to-lipid ratio was 1:5,000 (A and C) or 1:10,000 (E) (VSyt1 5K or VSyt1 10K, respectively). In the dT-liposomes, the dSNAP-25–to–lipid ratio was 1:800. In the T- and dT-liposomes, the syntaxin-1–to–lipid ratio was 1:800 (T 0.8K and dT 0.8K, respectively) (A), 1:2,500 (T 2.5K and dT 2.5K, respectively) (C), or 1:5,000 (T 5K and dT 5K, respectively) (E). The assays were performed in the presence of 1 µM Munc18-1, 0.2 µM Munc13-1C, 0.4 µM NSF, 2 µM α-SNAP, 5 µM excess SNAP-25 (only for experiments performed with T-liposomes), and 5 μM streptavidin. Experiments were started in the presence of 100 μM EGTA, and Ca2+ (600 μM) was added at 300 s. (B, D, and F) Quantification of the content mixing assays shown in A, C, and E. Bars represent averages of the normalized fluorescence intensities observed in the content mixing assays at 300 s (i.e., before Ca2+ addition) and at 600 s (i.e., 300 s after Ca2+ addition), performed in triplicates. Error bars represent SDs. Statistical significance and P values were determined by one-way ANOVA with the Holm–Sidak test (***P < 0.001).
Fig. 4.
Fig. 4.
Synergy between Syt1 and membrane anchoring of SNAP-25 in promoting liposome fusion at very low synaptobrevin and syntaxin-1 densities. (A and C) Content mixing between V- or VSyt1-liposomes and dT-liposomes (dT 5K) was monitored from the increase in the fluorescence signal of Cy5-streptavidin trapped in the V- or VSyt1-liposomes caused by FRET with PhycoE-biotin trapped in the dT-liposomes upon liposome fusion. The VSyt1 liposomes contained WT Syt1 or Syt1-bearing mutations in the Ca2+-binding sites of the C2A domain or the C2B domain (VSyt1 10K, VSyt1-C2A* 10K, or VSyt1-C2B* 10K, respectively). The synaptobrevin-to-lipid ratio in V- and VSyt1-liposomes was 1:10,000, and the Syt1-to-lipid ratio in VSyt1-liposomes was 1:1,000. In dT-liposomes, the syntaxin-1–to–lipid ratio was 1:5,000 and the dSNAP-25–to–lipid ratio was 1:800. The assays were performed in the presence of 1 µM Munc18-1, 0.2 µM Munc13-1C, 0.4 µM NSF, 2 µM α-SNAP, and 5 μM streptavidin. The assays of A and C were performed under analogous conditions with different preparations. In C, experiments with VSyt1 liposomes bearing mutations in the Ca2+-binding sites of both C2 domains (VSyt1-C2A*B* 10K) were also included. (E) Content mixing assays analogous to those shown in A and C but omitting Munc13-1C and replacing WT Munc18-1 with Munc18-1 D326K. All experiments were started in the presence of 100 μM EGTA, and Ca2+ (600 μM) was added at 300 s. (B, D, and F) Quantification of the content mixing assays shown in A, C, and E. Bars represent averages of the normalized fluorescence intensities observed in the content mixing assays at 300 s (i.e., before Ca2+ addition) and at 600 s (i.e., 300 s after Ca2+ addition), performed in triplicates. Error bars represent SDs. Statistical significance and P values were determined by one-way ANOVA with the Holm–Sidak test (***P < 0.001).

Similar articles

Cited by

References

    1. Südhof T. C., Neurotransmitter release: The last millisecond in the life of a synaptic vesicle. Neuron 80, 675–690 (2013). - PMC - PubMed
    1. Rizo J., Mechanism of neurotransmitter release coming into focus. Protein Sci. 27, 1364–1391 (2018). - PMC - PubMed
    1. Brunger A. T., Choi U. B., Lai Y., Leitz J., Zhou Q., Molecular mechanisms of fast neurotransmitter release. Annu. Rev. Biophys. 47, 469–497 (2018). - PMC - PubMed
    1. Söllner T., Bennett M. K., Whiteheart S. W., Scheller R. H., Rothman J. E., A protein assembly-disassembly pathway in vitro that may correspond to sequential steps of synaptic vesicle docking, activation, and fusion. Cell 75, 409–418 (1993). - PubMed
    1. Hanson P. I., Roth R., Morisaki H., Jahn R., Heuser J. E., Structure and conformational changes in NSF and its membrane receptor complexes visualized by quick-freeze/deep-etch electron microscopy. Cell 90, 523–535 (1997). - PubMed

Publication types

MeSH terms

LinkOut - more resources