Comparative Study
. 2021 Jan 26;118(4):e2023236118.
doi: 10.1073/pnas.2023236118.

Longitudinal shear stress response in human endothelial cells to atheroprone and atheroprotective conditions

Affiliations
Comparative Study

Longitudinal shear stress response in human endothelial cells to atheroprone and atheroprotective conditions

Mano R Maurya et al. Proc Natl Acad Sci U S A. .

Abstract

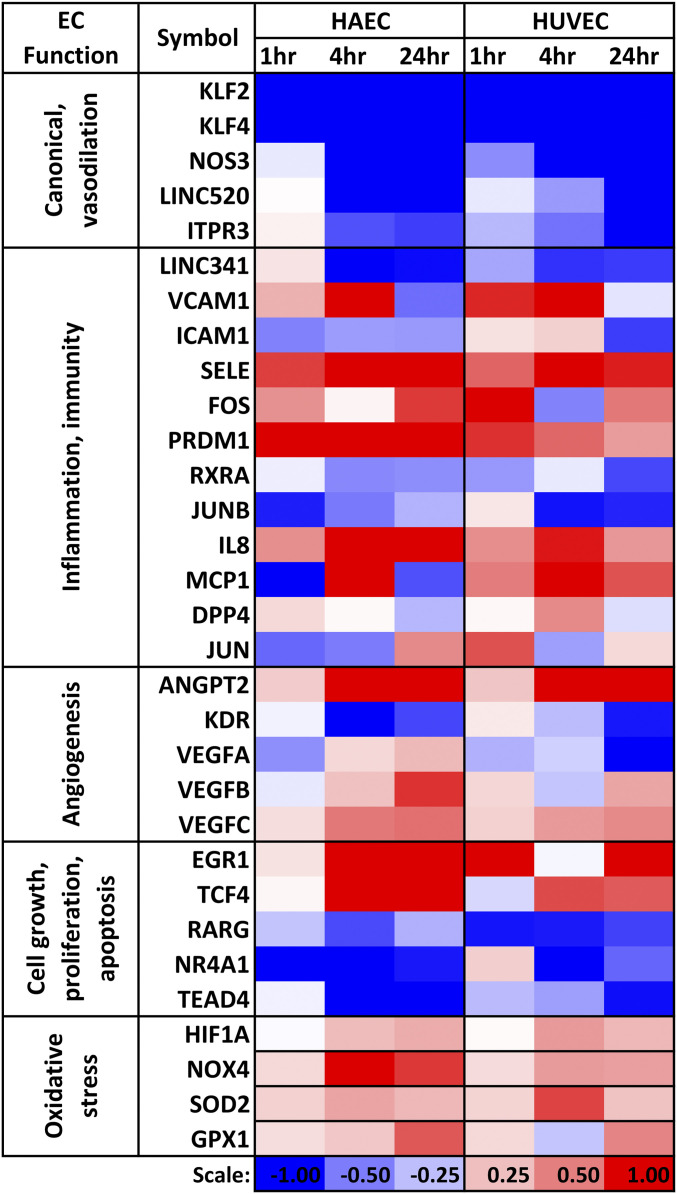
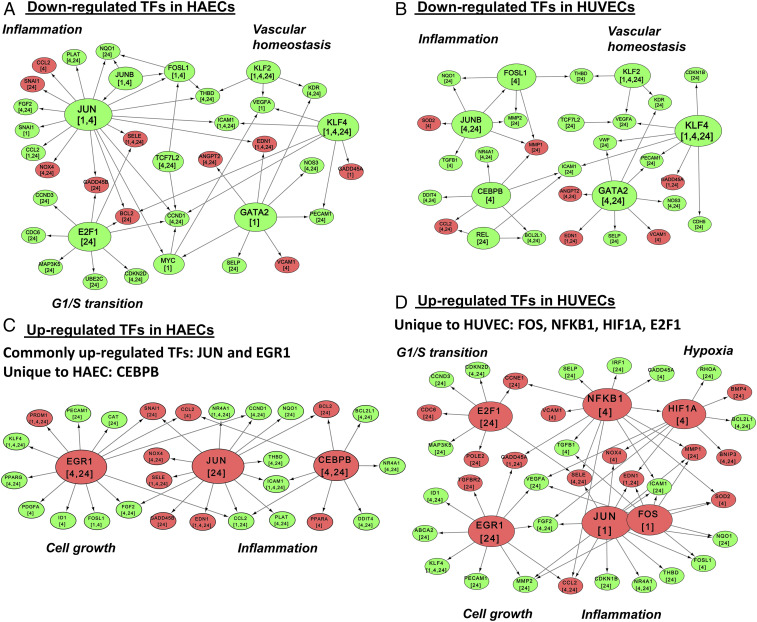
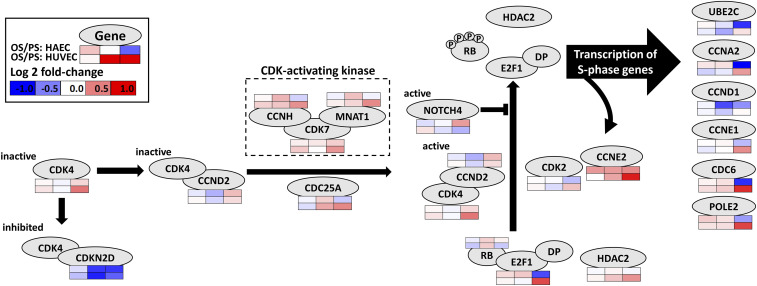
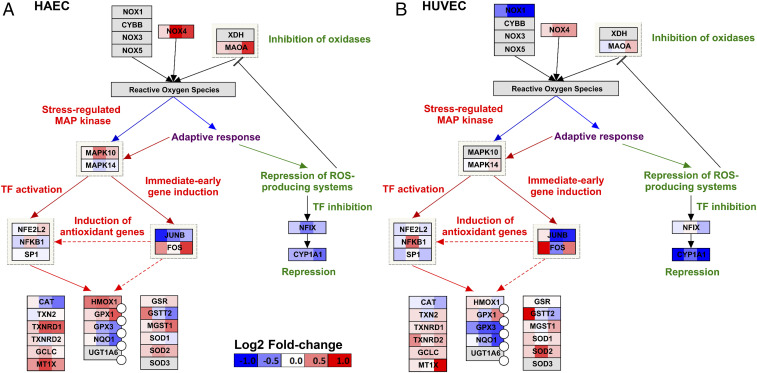
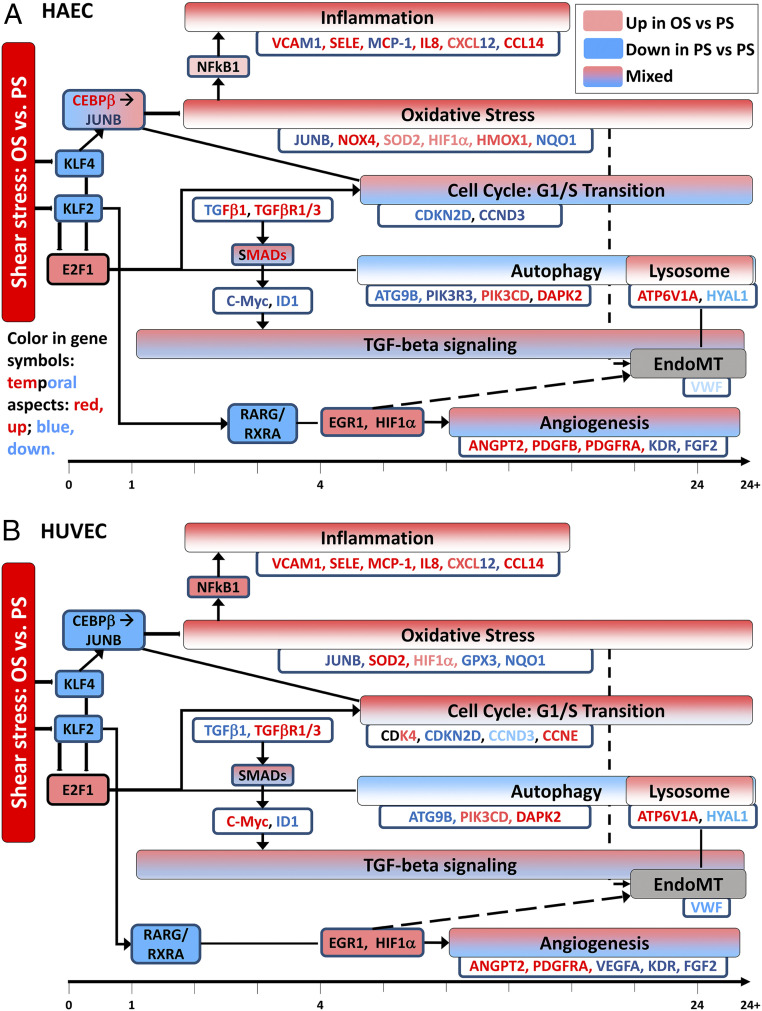
The two main blood flow patterns, namely, pulsatile shear (PS) prevalent in straight segments of arteries and oscillatory shear (OS) observed at branch points, are associated with atheroprotective (healthy) and atheroprone (unhealthy) vascular phenotypes, respectively. The effects of blood flow-induced shear stress on endothelial cells (ECs) and vascular health have generally been studied using human umbilical vein endothelial cells (HUVECs). While there are a few studies comparing the differential roles of PS and OS across different types of ECs at a single time point, there is a paucity of studies comparing the temporal responses between different EC types. In the current study, we measured OS and PS transcriptomic responses in human aortic endothelial cells (HAECs) over 24 h and compared these temporal responses of HAECs with our previous findings on HUVECs. The measurements were made at 1, 4, and 24 h in order to capture the responses at early, mid, and late time points after shearing. The results indicate that the responses of HAECs and HUVECs are qualitatively similar for endothelial function-relevant genes and several important pathways with a few exceptions, thus demonstrating that HUVECs can be used as a model to investigate the effects of shear on arterial ECs, with consideration of the differences. Our findings show that HAECs exhibit an earlier response or faster kinetics as compared to HUVECs. The comparative analysis of HAECs and HUVECs presented here offers insights into the mechanisms of common and disparate shear stress responses across these two major endothelial cell types.

Keywords: atherosclerosis; endothelial cells; systems biology; temporal analysis of flow response; transcriptomics.


Conflict of interest statement

The authors declare no competing interest.

Figures

Fig. 1.
Fig. 1.
Heatmap of log2(OS/PS fold change) for select EC function-relevant genes in HAECs and HUVECs across time. Dataset S1 (“OSbyPS_L2FC”) provides the log2 fold change for all the genes with raw read count >10.
Fig. 2.
Fig. 2.
Comparison of transcriptional regulatory networks under OS and PS conditions. Shown are important targets of down-regulated TFs in HAECs (A) and HUVECs (B), and important targets of up-regulated TFs in HAECs (C) and HUVECs (D). The TF target relationships were obtained from the TRANSFAC database. DE TFs were connected to their DE targets when the target was DE at the same or a later time point. The green and red colors for the TF nodes indicate down-regulation and up-regulation, respectively. The same color coding is used for the target nodes.
Fig. 3.
Fig. 3.
Commonalities and differences in the G1/S transition in HAECs and HUVECs. The temporal gene expression changes are shown as heat maps Below or Above the gene nodes (oval shapes). The up-regulation of CDK-activating kinases such as CDK7 activates CDK4 (bound to CCND2), which phosphorylates RB. In G1 phase, the TF E2F1 is bound to RB. The phosphorylation of RB causes the release of E2F1, which can then move into the nucleus to regulate the expression of its target genes. RB phosphorylation is also promoted by the binding of CDK2 to CCNE2. CDK4, CDK7, CCND2, and CCNE2 levels are slightly to moderately increased in both cell types, especially at 24 h. Thus, RB is getting phosphorylated in both cell types. However, E2F1 levels are down-regulated in HAECs and up-regulated in HUVECs at 24 h. Thus, in HAECs, the net effect on S-phase genes may be mixed. In our data, most S-phase gene targets of E2F1 are indeed down-regulated at 24 h in HAECs. In HUVECs, E2F1 and its targets such as CDC6 and POLE2 are up-regulated at 24 h.
Fig. 4.
Fig. 4.
Comparison of OS vs. PS differential expression response of (A) HAECs and (B) HUVECs for Oxidative Stress pathway (WikiPathways)-related genes. Color scale of log2 fold changes: −1 (blue) to 0 (white) to +1 (red). The overall response at the pathway level is similar for the two cell types, although some genes show stronger fold changes in HAECs vs. HUVECs (e.g., NOX4) or weaker fold changes in HAECs vs. HUVECs (e.g., CYP1A1 or SOD2). For some genes, e.g., JUNB, the difference is temporal.
Fig. 5.
Fig. 5.
Temporal map of changes in EC function-relevant pathways in HAECs (A) and HUVECs (B). Color-filled boxes represent pathways. Pathways and genes in red are up-regulated (up) by OS vs. PS, while those in blue are down-regulated (down) by OS vs. PS. Some pathways such as TGF-β signaling pathway and angiogenesis are shown in “mixed” color (gradient) due to mixed response (both up- and down-regulated). Such mixed response is generally observed across the time course. For the cell cycle pathway, CCND3 is down-regulated strongly in HAECs, but only moderately in HUVECs. CDK4 is moderately up-regulated only in HUVECs. Inflammation-related processes and oxidative stress response pathway show overall similar response in both cell types, although there are some temporal differences in specific genes. NFκB is slightly and moderately up-regulated in HAECs and HUVECs, respectively, and JUNB and NQO1 are down-regulated in both cell types. SOD2, one of the key genes related to oxidative stress, is up-regulated significantly in HUVECs, but only slightly in HAECs, although the response persists across time. HIF1α is slightly up-regulated in both cell types. While the angiogenesis pathway and its genes show mixed responses in both cell types and the responses are broadly similar, the changes appear earlier in HAECs than HUVECs. Autophagy and lysosome pathways are overall down- and up-regulated, respectively, in both cell types, although there are minor differences in the differential expression of several genes. Angiogenesis exhibits mixed response in both cell types.

References

    1. Chiu J. J., Chien S., Effects of disturbed flow on vascular endothelium: Pathophysiological basis and clinical perspectives. Physiol. Rev. 91, 327–387 (2011). - PMC - PubMed
    1. Chistiakov D. A., Orekhov A. N., Bobryshev Y. V., Effects of shear stress on endothelial cells: Go with the flow. Acta Physiol. (Oxf.) 219, 382–408 (2017). - PubMed
    1. Baeyens N., Bandyopadhyay C., Coon B. G., Yun S., Schwartz M. A., Endothelial fluid shear stress sensing in vascular health and disease. J. Clin. Invest. 126, 821–828 (2016). - PMC - PubMed
    1. Dai G., et al. , Distinct endothelial phenotypes evoked by arterial waveforms derived from atherosclerosis-susceptible and -resistant regions of human vasculature. Proc. Natl. Acad. Sci. U.S.A. 101, 14871–14876 (2004). - PMC - PubMed
    1. Patel H., Chen J., Das K. C., Kavdia M., Hyperglycemia induces differential change in oxidative stress at gene expression and functional levels in HUVEC and HMVEC. Cardiovasc. Diabetol. 12, 142 (2013). - PMC - PubMed

Publication types

MeSH terms