. 2021 Jan 26;118(4):e2014634118.
doi: 10.1073/pnas.2014634118.

The Tiger Rattlesnake genome reveals a complex genotype underlying a simple venom phenotype

Affiliations

The Tiger Rattlesnake genome reveals a complex genotype underlying a simple venom phenotype

Mark J Margres et al. Proc Natl Acad Sci U S A. .

Abstract

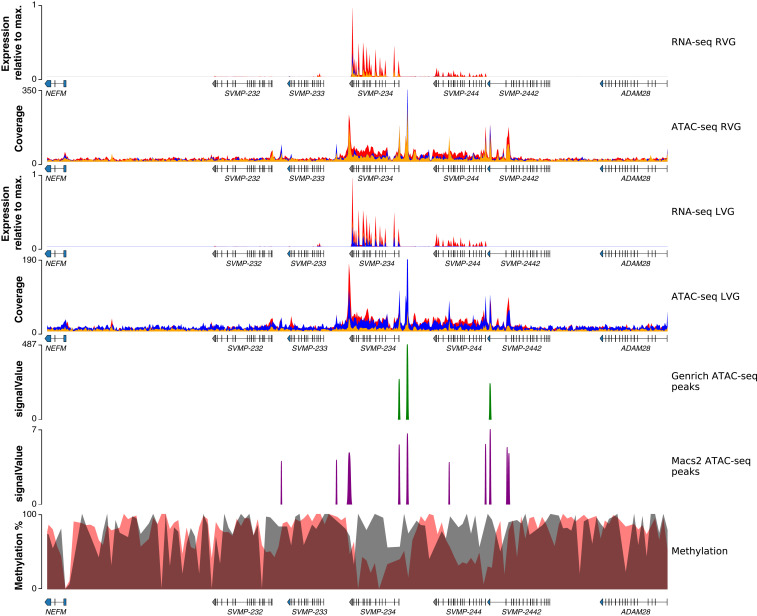
Variation in gene regulation is ubiquitous, yet identifying the mechanisms producing such variation, especially for complex traits, is challenging. Snake venoms provide a model system for studying the phenotypic impacts of regulatory variation in complex traits because of their genetic tractability. Here, we sequence the genome of the Tiger Rattlesnake, which possesses the simplest and most toxic venom of any rattlesnake species, to determine whether the simple venom phenotype is the result of a simple genotype through gene loss or a complex genotype mediated through regulatory mechanisms. We generate the most contiguous snake-genome assembly to date and use this genome to show that gene loss, chromatin accessibility, and methylation levels all contribute to the production of the simplest, most toxic rattlesnake venom. We provide the most complete characterization of the venom gene-regulatory network to date and identify key mechanisms mediating phenotypic variation across a polygenic regulatory network.

Keywords: chromatin; gene regulation; genotype–phenotype; methylation.


Conflict of interest statement

The authors declare no competing interest.

Figures

Fig. 1.
Fig. 1.
A complex genetic architecture underlies the simple venom phenotype of the Tiger Rattlesnake. (A) Comparative proteomics shows the simplicity of the Tiger Rattlesnake (C. tigris) venom phenotype. RP-HPLC of whole venoms for eight individuals across six species of rattlesnake. Chromatographic peaks represent a particular toxic protein or set of proteins. Estimates of VC, our proxy for phenotypic complexity, are shown next to each venom profile, and the Tiger Rattlesnake (VC = 5.15) possessed a significantly simpler venom than all other rattlesnakes shown here (see SI Appendix, Table S1 for details). For species polymorphic for the A–B venom dichotomy, where type A venoms are simple and neurotoxic and type B venoms are complex and hemotoxic, venom type is listed next to species name. C. tigris possesses a type A venom, whereas Crotalus adamanteus, C. atrox, and C. viridis possess type B venoms. See SI Appendix, Fig. S4 for transcriptome–proteome relationship in C. tigris. (B) Circos plot of the RaGOO assembly displaying gene density, repeat content, GC content, proportion of methylated cytosines in the venom gland, and chromatin accessibility in the venom gland across 100-kb windows at chromosome scale. Venom toxins that were reliably mapped to chromosome scaffolds are shown as colored vertical lines and labeled accordingly. CRISP, cysteine-rich secretory protein; HYAL, hyaluronidase; KUN, Kunitz-type toxin; LAAO, L-amino acid oxidase; MYO, myotoxin; NGF, nerve growth factor; NUC, nucleotidase; PDE, phosphodiesterase; PLB, phospholipase B; VEGF, vascular endothelial growth factor; VF, venom factor. Snake image credits: M.P.H. and Travis Fisher (photographer).
Fig. 2.
Fig. 2.
Gene losses in two major toxin-gene families partly facilitate the evolution of a simple venom phenotype in the Tiger Rattlesnake (C. tigris). Genomic position for the PLA2 (Upper) and SVMP (Lower) toxin tandem arrays across several rattlesnake species. Toxin genes are shown as black boxes, and toxin-gene nomenclature is taken from Dowell et al. (22, 23). Flanking nontoxin genes (e.g., OTUD3) are shown as white boxes. The Tiger Rattlesnake genome has large deletions in both toxin tandem arrays, although deletions do not completely explain the simplest venom phenotype; for example, five functional SVMP genes are retained in the genome, but only two are expressed. PII, type II SVMP; PIII, type III SVMP.
Fig. 3.
Fig. 3.
Methylation levels and chromatin accessibility jointly regulate gene expression in the venom glands of the Tiger Rattlesnake. (A) Distributions of methylation levels for pancreas, active venom glands (VG), and resting VGs across venom-gland-specific chromatin-accessible regions (Open), high-expression toxin-gene TSSs (High TPM Toxin TSS), all toxin-gene TSSs, low-expression (Low TPM) toxin-gene TSSs, entire toxin-genic regions including introns (Toxin), all nontoxin-gene TSSs, entire nontoxin-genic regions including introns (Nontoxin), intergenic regions, and inaccessible chromatin regions (Closed). TSS regions included ±500 bp around the estimated start site. High TPM toxins represent the 20 most highly expressed toxins (TPM > 1,000). Low TPM toxins represent the 32 transcripts with TPM < 1,000. Nontoxin genes represent genes actively expressed in the VGs that do not produce toxic proteins. Statistical significance was assessed by using t tests. Pie charts represent the proportion of 10,000 bootstrapped t tests that were significant (P < 0.05) after subsampling; green represents significant tests, and gray represents nonsignificant tests. (B) Difference in methylation level for TSS (±500 bp) across pancreas and VGs significantly predicts expression differences across the same tissues. Each point represents an individual transcript. Blue points represent nontoxins that were significantly differentially expressed (DE) across VGs and pancreas (mean TPM > 300; Padj < 0.01). Black points represent nontoxins that were not significantly DE across VGs and pancreas (mean TPM > 300; Padj > 0.1). Red points represent toxins. The y axis shows the difference in expression between VGs and pancreas; positive values represent transcripts more highly expressed in the VGs, whereas negative values represent transcripts more highly expressed in the pancreas. The x axis shows the difference in methylation level between VGs and pancreas; positive values represent transcripts more highly methylated in the VGs, whereas negative values represent transcripts more highly methylated in the pancreas. Overall, transcripts that exhibit DE across pancreas and VGs also exhibit differences in methylation levels; transcripts that are more highly expressed in the VGs have reduced methylation levels in the VG and vice versa. (C and D) Chromatin accessibility and methylation level are significantly negatively correlated across the PLA2 (C) and SVMP (D) genomic regions. The y axis represents log-transformed ATAC-seq mean coverage estimates across 2-kb bins for all three VGs. The x axis represents mean methylation percentage across 2-kb bins for both VGs sequenced.
Fig. 4.
Fig. 4.
Regulatory landscape for the PLA2 toxin-gene family in the Tiger Rattlesnake. Chromatin accessibility and methylation levels regulate the expression of PLA2 toxin genes with increased accessibility and reduced methylation near active genes (i.e., PLA2-B2 and -A2) and reduced accessibility and increased methylation near silenced genes. Rows from top to bottom: right venom-gland (RVG) transcriptome, RVG ATAC-seq, left venom-gland (LVG) transcriptome, LVG ATAC-seq, venom-gland specific ATAC-seq peaks identified by Genrich, venom-gland specific ATAC-seq peaks identified by MACS2, and methylation percentage. RNA-seq y axes represent venom-gland expression levels scaled by the most highly expressed transcript in that genomic region. Red, blue, and orange colors in the RNA-seq and ATAC-seq plots represent the three individuals sequenced, respectively; colors are overlaid, and not all may be visible. Genrich-estimated signalValues represent the area under the peak; MACS2-estimated signalValues represent fold change in coverage at the peak summit. For the methylation track, gray shading represents methylation levels in 2-kb bins in the pancreas (control), whereas red shading represents methylation levels in 2-kb bins in the venom gland. Gene annotations are shown under tracks where appropriate; PLA2-B2, -C2, and -A2 are toxin genes. Max., maximum.
Fig. 5.
Fig. 5.
Regulatory landscape for the SVMP toxin-gene family in the Tiger Rattlesnake. Chromatin accessibility and methylation levels regulate the expression of SVMP toxin genes with increased accessibility and reduced methylation near active genes (i.e., SVMP-234 and SVMP-244) and reduced accessibility and increased methylation near silenced genes. Rows from top to bottom: right venom-gland (RVG) transcriptome, RVG ATAC-seq, left venom-gland (LVG) transcriptome, LVG ATAC-seq, venom-gland-specific ATAC-seq peaks identified by Genrich, venom-gland-specific ATAC-seq peaks identified by MACS2, and methylation percentage. RNA-seq y axes represent venom-gland expression levels scaled by the most highly expressed transcript in that genomic region. Red, blue, and orange colors in the RNA-seq and ATAC-seq plots represent the three individuals sequenced, respectively; colors are overlaid, and not all may be visible. Genrich-estimated signalValues represent the area under the peak; MACS2-estimated signalValues represent fold change in coverage at the peak summit. For the methylation track, gray shading represents methylation levels in 2-kb bins in the pancreas (control), whereas red shading represents methylation levels in 2-kb bins in the venom gland. Gene annotations are shown under tracks where appropriate; SVMP-232, SVMP-233, SVMP-234, SVMP-244, and SVMP-2442 are toxin genes. Max., maximum.

References

    1. Slack J., Metaplasia and transdifferentiation: From pure biology to the clinic. Nat. Rev. Mol. Cell Biol. 8, 369–378 (2007). - PubMed
    1. Van Belleghem S., et al. , Complex modular architecture around a simple toolkit of wing pattern genes. Nat. Ecol. Evol. 1, 0052 (2017). - PMC - PubMed
    1. Lewis J., Reed R., Genome-wide regulatory adaptation shapes population-level genomic landscapes in Heliconius. Mol. Biol. Evol. 36, 159–173 (2018). - PMC - PubMed
    1. Sackton T., et al. , Convergent regulatory evolution and loss of flight in paleognathous birds. Science 364, 74–78 (2019). - PubMed
    1. Halfon M., Perspectives on gene regulatory network evolution. Trends Genet. 33, 436–447 (2017). - PMC - PubMed

Publication types

Substances

LinkOut - more resources