. 2021 Jan 19;12(1):447.
doi: 10.1038/s41467-020-20666-3.

Choroid plexus NKCC1 mediates cerebrospinal fluid clearance during mouse early postnatal development

Affiliations

Choroid plexus NKCC1 mediates cerebrospinal fluid clearance during mouse early postnatal development

Huixin Xu et al. Nat Commun. .

Abstract

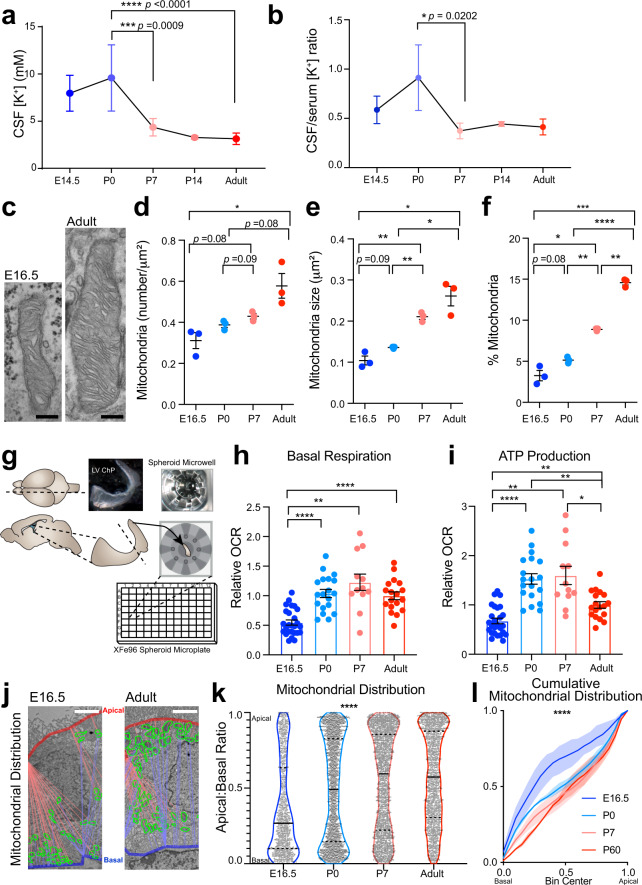
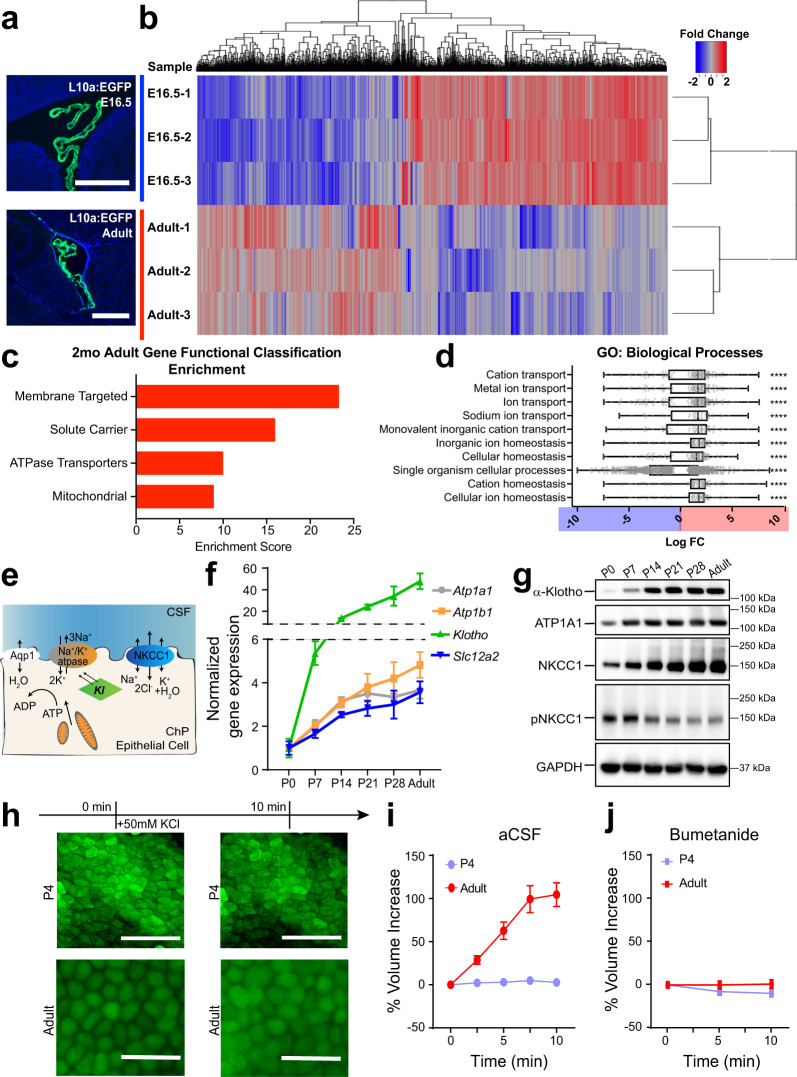
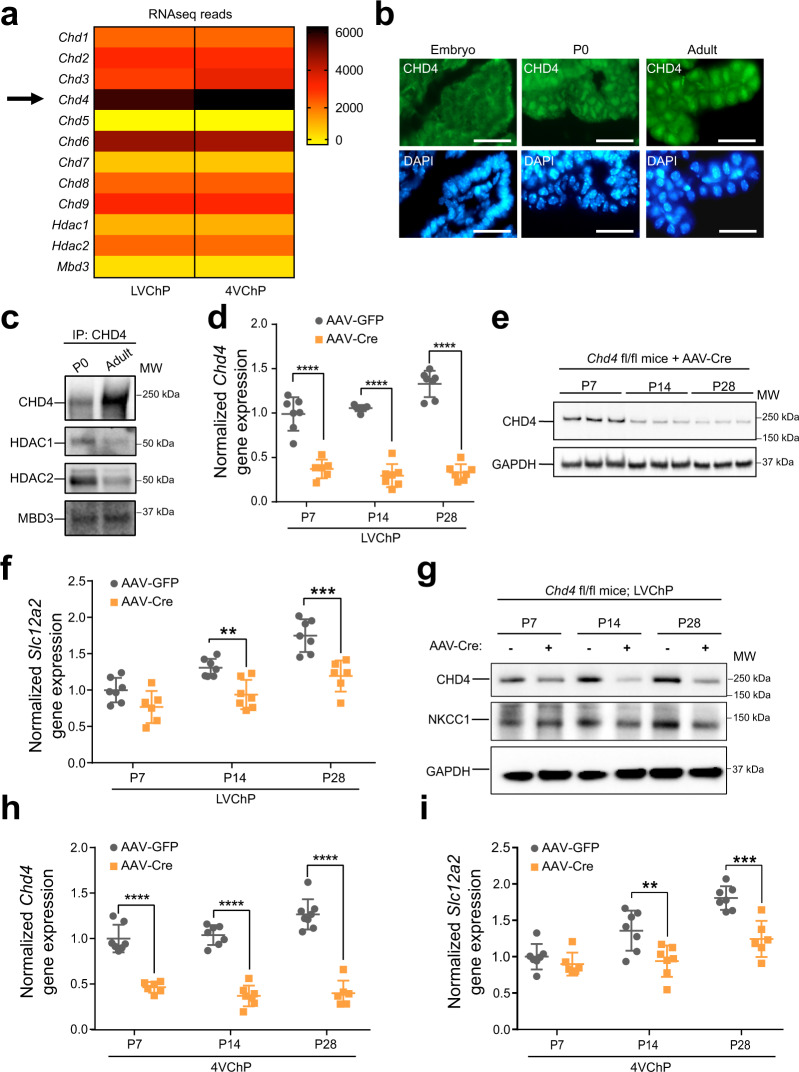
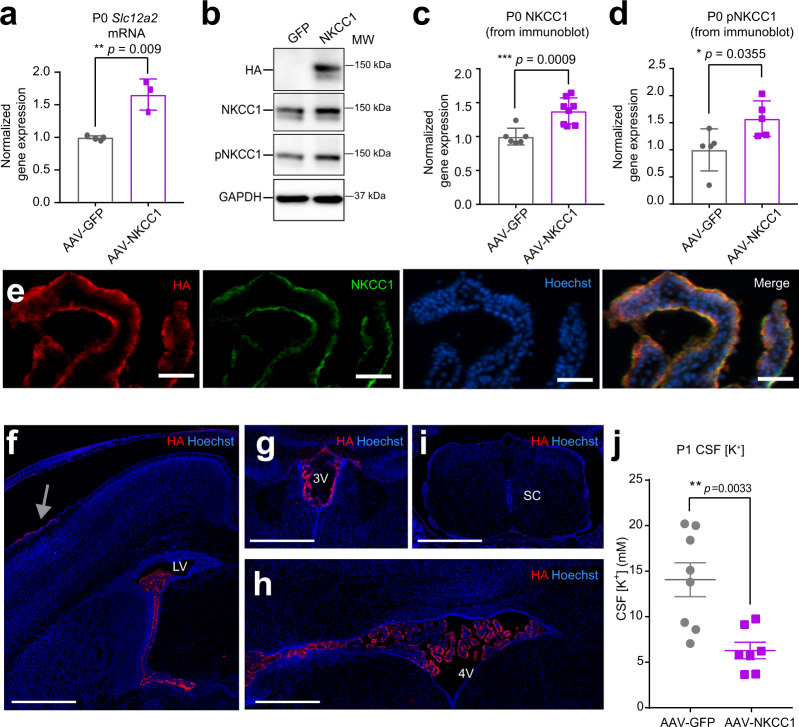
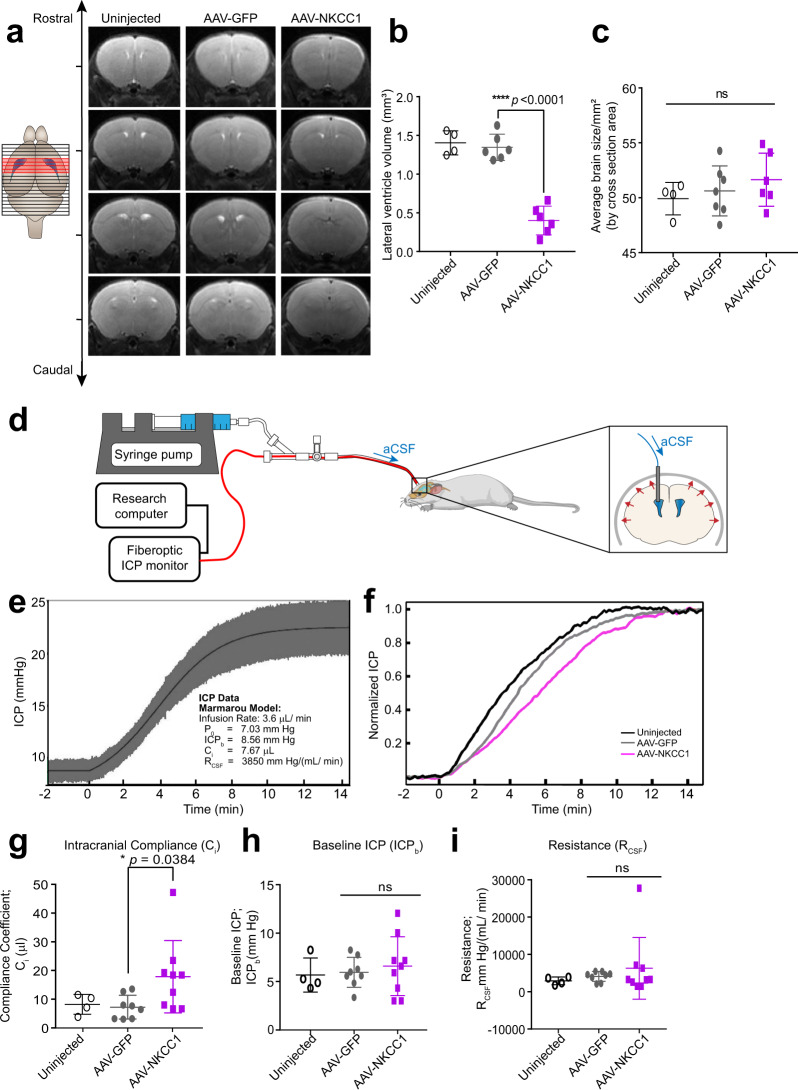
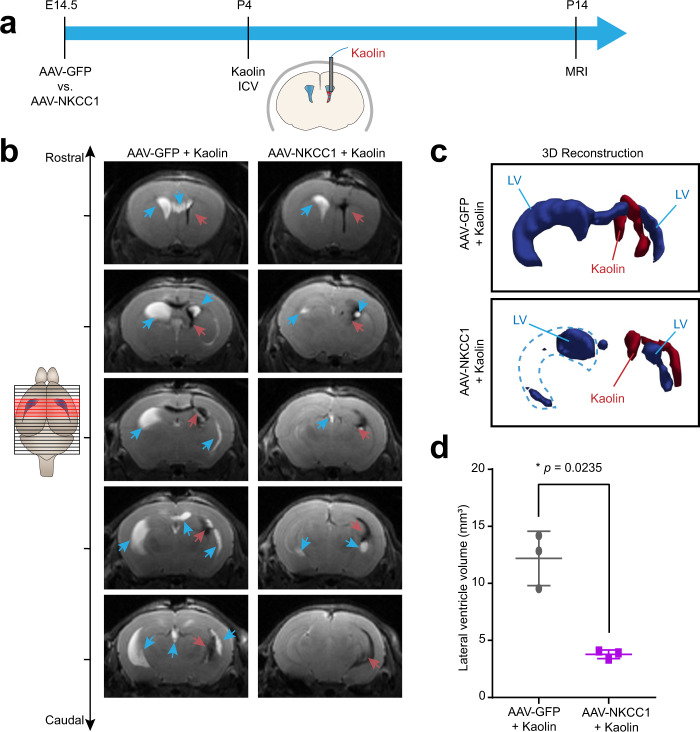
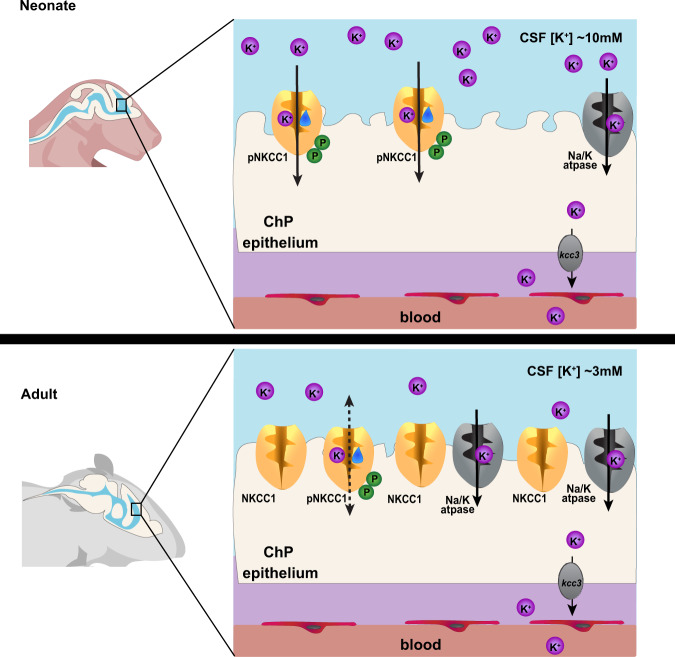
Cerebrospinal fluid (CSF) provides vital support for the brain. Abnormal CSF accumulation, such as hydrocephalus, can negatively affect perinatal neurodevelopment. The mechanisms regulating CSF clearance during the postnatal critical period are unclear. Here, we show that CSF K+, accompanied by water, is cleared through the choroid plexus (ChP) during mouse early postnatal development. We report that, at this developmental stage, the ChP showed increased ATP production and increased expression of ATP-dependent K+ transporters, particularly the Na+, K+, Cl-, and water cotransporter NKCC1. Overexpression of NKCC1 in the ChP resulted in increased CSF K+ clearance, increased cerebral compliance, and reduced circulating CSF in the brain without changes in intracranial pressure in mice. Moreover, ChP-specific NKCC1 overexpression in an obstructive hydrocephalus mouse model resulted in reduced ventriculomegaly. Collectively, our results implicate NKCC1 in regulating CSF K+ clearance through the ChP in the critical period during postnatal neurodevelopment in mice.


Conflict of interest statement

The authors declare no competing interests.

Figures

Fig. 1
Fig. 1. Postnatal CSF [K+] decrease coincides with increased choroid plexus metabolism.
a ICP-OES quantification of CSF [K+]. Colors: blue-to-red indicate increasing age in all panels. ***p = 0.0009, ****p < 0.0001; Sidak’s test. b Developmental CSF/Serum [K+] ratios. Ratio = CSF [K+]/average serum [K+]; Sidak’s test. *p = 0.0202. c Transmission micrographs of LVChP mitochondria. df Quantification of mitochondrial number (d), area (e), and % area occupancy (f) in ChP epithelial cells. d *p = 0.0269; e E16.5 vs. P7 **p = 0.0025; E16.5 vs. adult *p = 0.0115; P0 vs. P7 **p = 0.0062; P0 vs. adult *p = 0.0344; f E16.5 vs. P7 *p = 0.0112; E16.5 vs. adult ***p = 0.0008; P0 vs. P7 **p = 0.0010; P0 vs. adult ****p < 0.001; P7 vs. adult **p = 0.0010; Welch’s two-tailed unpaired t-test. g Schematic of explant-based Agilent Seahorse XFe96 test. h, i Oxidative respiration metrics over development; OCR oxygen consumption rate. h E16.5 vs. P0 ****p < 0.0001; E16.5 vs. P7 ***p = 0.0025; E16.5 vs. Adult ****p < 0.0001; i E16.5 vs. P0 ****p < 0.0001; E16.5 vs. P7 **p = 0.0022; E16.5 vs. Adult **p = 0.0037; P0 vs. Adult **p = 0.0012; P7 vs. Adult *p = 0.0480; Welch’s ANOVA with Dunnett’s T3 multiple comparison test. j, k Mitochondrial distribution apical: basal proximity ratio: 1 = apical surface. 0 = basal surface. Solid line: median; dashed line: upper/lower quartiles. ****p < 0.0001; Kolmogorov–Smirnov test. l Cumulative distribution of mitochondrial localization. Solid lines: mean; shaded area: range. Scale bar = c 250 nm, j 2 μm. All quantitative data presented as mean ± SEM. LVChP lateral ventricle choroid plexus, E embryonic day, P postnatal day. Information on replicates and reproducibility for this figure can be found in the “Statistics and Reproducibility” section of the Methods. Source data are provided as a Source Data file.
Fig. 2
Fig. 2. Choroid plexus epithelial cells display age-dependent translation of ion and water transporters, in particular NKCC1.
a Rpl10a-conjugated EGFP expression in ChP epithelial cells after Foxj1-Cre recombination in TRAP-BAC mice. Scale bars = 500 μm. Representative of two experiments, each with two biologically independent replicates. b Heatmap and hierarchical clustering of differentially expressed genes (adjusted p < 0.05). Red: enriched adult expression. Blue: enriched E16.5 expression. c Top four gene functional clusters shown by DAVID to be enriched in Adult ChP epithelial cells over E16.5 ChP epithelial cells. d Top 10 significantly enriched gene ontology (GO) terms for “Biological processes”. Plotted with horizontal lines for medians, bounds of boxes for quartiles, and whiskers for maximum and minimum values. The log10 fold change (LogFC) is plotted for each expressed gene for the network. Positive values (red): Adult enrichment; negative values (blue): E16.5 enrichment. Multiple measures were corrected using Bonferroni correction. **p ≤ 0.01, ***p ≤ 0.001, ****p ≤ 0.0001 (See Supplementary Data S1 for exact p-values). e Schematics depicting the interaction of NKCC1, Na+/K+-ATPase, and Klotho (Kl) on the apical membrane of a ChP epithelial cell. f, g RT-qPCR and immunoblotting of LVChP during postnatal development. f N = 4 biologically independent animals from two experiments at each timepoint. Colors are matched to the gene’s protein name in Fig. 2e. g: representative of three independent experiments, each with tissues from 1–2 animals (two animals for ages under P14, one animal for ages of P14 and older) pooled for each timepoint. h Fluorescence images of Calcein-AM labeled epithelial cells from LVChP explants under high extracellular K+ challenge. Scale bar = 50 µm, representative of four biological replicates collected from three independent experiments. Biological replicates with poor calcein labeling or visible damage were excluded prior to K+ challenge. i, j Quantification of ChP epithelia cellular volume by IMARIS 3D analysis. Percent volume increase = dV/V0 for each timepoint (t). V0 = initial volume of the cell; t = subsequent timepoint after challenge; dV = Vt − V0 × 100%. At least five cells were analyzed for each explant from each animal; N = 4 animals. Red: adults; light blue: P4. All quantitative data are presented as mean ± SD. Source data are provided as a Source Data file.
Fig. 3
Fig. 3. NKCC1 temporal expression requires the CHD4/NuRD complex.
a RNA-seq data showing expression of CHD and other NuRD units by the ChP. Yellow: low expression; Dark brown: high expression. b Immunofluorescence images of CHD4 in the ChP epithelia at E16.5, P0, and adult; Scale bar = 30 µm. A total of four animals at each age were imaged in two independent experiments. c Immunoblots of Co-IP by CHD4 antibody. Representative of two independent experiments, each contain more than 10 animals for each age. d RT-qPCR of CHD4 transcripts in ChP with AAV2/5-Cre transduction. Gray: AAV-GFP; orange: AAV-Cre (same color scheme is used for the rest of the figure). ****p < 0.0001, N = 7, Welch’s two-tailed unpaired t-test. e Immunoblot of CHD4 in AAV-Cre mice ChP lysate, representative of three independent experiment, each contain two or three independent animals. f RT-qPCR of NKCC1 expression in AAV-Cre vs. AAV-GFP mice ChP. All values were normalized to P7 AAV-GFP control mice. **p = 0.0015, ***p = 0.0009, N = 7, Welch’s two-tailed unpaired t-test. g Immunoblot of NKCC1 in LVChP lysates from AAV-Cre vs. AAV-GFP mice, representative of three independent experiments, each containing two or three independent animals (same samples as those collected for Fig. 2e). h, i CHD4 and NKCC1 RT-qPCR in 4VChP. **p = 0.0083, ***p = 0.0005, ****p < 0.0001, N = 7, Welch’s two-tailed unpaired t-test. All quantitative data are presented as mean ± SD. When immunoblots were quantified, all samples for quantitative comparison were on the same blot. Source data are provided as a Source Data file.
Fig. 4
Fig. 4. ChP NKCC1 actively mediates CSF K+ clearance during the first postnatal week.
a RT-qPCR of NKCC1 mRNA levels in P0 mice. Gray: AAV-GFP; purple: AAV-NKCC1 (same color scheme is used for the rest of this figure). **p = 0.009, N = 3; Welch’s two-tailed unpaired t-test. b Immunoblots from AAV-NKCC1 vs. AAV-GFP P0 mice ChP lysates, representative of three independent experiments, each contained multiple biological replicates (the exact numbers and raw blots are included in the Source Data with quantification presented in panels c and d). c, d Quantification of all immunoblots of NKCC1 c ***p = 0.0009, N = 7; Welch’s two-tailed unpaired t-test; and pNKCC1 d *p = 0.0355, N = 5; Welch’s two-tailed unpaired t-test. All samples for direct quantitative comparison were on the same blot (see Source Data). e Immunofluorescence images showing colocalization of 3xHA tag and NKCC1 in P0 ChP. Scale bar = 50 µm, representative of three independent experiments, each with two biological replicates. fi Immunofluorescence images of HA in AAV2/5-NKCC1 transduced brain at P1: LVChP (f), 3rd ventricle ChP (3VChP) (g), 4VChP (h), and the spinal cord (i sc = spinal cord). Trace expression of HA in the meninges near the injection site (gray arrow). Scale bar = 500 µm. fi are representative of two independent experiments, each with three biological replicates. j ICP-OES measurements of CSF [K+] from AAV-NKCC1 vs. AAV-GFP P1 mice (N = 8 in AAV-GFP cohort; N = 7 in AAV-NKCC1 cohort). **p = 0.0033; Welch’s two-tailed unpaired t-test. All quantitative data are presented as mean ± SD. Source data are provided as a Source Data file.
Fig. 5
Fig. 5. ChP NKCC1 overexpression reduces brain ventricular volume and increases intracranial compliance.
a T2-weighted live MRI images. Only slices with visible lateral and 3rd ventricles are shown (marked red in the schematics; for NKCC1 OE mice, slices matching with control mice are shown regardless of ventricles). b Lateral ventricle volumes. Uninjected N = 4; AAV-GFP and AAV-NKCC1 N = 6, from two independent experiments; Black with no fill: uninjected; gray: AAV-GFP; purple: AAV-NKCC1 (the same color scheme is used for the rest of this figure). ****p < 0.0001; Welch’s two-tailed unpaired t-test. c Brain sizes, which are presented as the average coronal section area from all images with visible lateral and 3rd ventricles (marked red in the schematic; NKCC1 OE data were calculated using the matching images to the controls, regardless of ventricles visibility). Uninjected N = 4; AAV-GFP and AAV-NKCC1 N = 6 (same as mice included in panel b); Welch’s two-tailed unpaired t-test. d Schematic of in vivo constant rate CSF infusion test. e Example of ICP curve during the infusion test (infusion begins at 0 min) in an AAV-GFP mouse, fitted to Marmarou’s model. Values extracted include: baseline ICP (ICPb), a pressure-independent compliance coefficient (Ci) and the resistance to CSF outflow (RCSF). f Example ICP recordings from AAV-NKCC1 mice and controls. For clarity, data have been low pass filtered to remove the waveform components. g Compliance coefficients. Uninjected N = 4; AAV-GFP N = 8; AAV-NKCC1 N = 9; 3 total independent experiments. *p = 0.0384; Welch’s two-tailed unpaired t-test. h, i Plots of baseline ICP and resistance to CSF outflow (RCSF) at 5–7 weeks. Uninjected N = 4, AAV-GFP N = 8, AAV-NKCC1 N = 9; 3 total independent experiments (same experiments as those included in g). Welch’s two-tailed unpaired t-test. All quantitative data are presented as mean ± SD.
Fig. 6
Fig. 6. ChP NKCC1 overexpression mitigates ventriculomegaly in an obstructive hydrocephalus model.
a Schematics showing the workflow: E14.5 in utero ICV of AAV2/5-NKCC1 or AAV2/5-GFP, followed by ICV of kaolin at P4, and MRI at P14. b Representative sequential brain images (rostral to caudal) by T2-weighted live MRI images. Blue arrows: Lateral ventricle (LV). Red arrows: kaolin. c 3D reconstruction of the LV and kaolin deposition. LV: blue. Kaolin: red. d Lateral ventricle volumes. N = 3 from two biologically independent litters under each condition; Gray: AAV-GFP mice with kaolin; purple: AAV-NKCC1 mice with kaolin. *p = 0.0.0235; Welch’s two-tailed unpaired t-test. All quantitative data are presented as mean ± SD.
Fig. 7
Fig. 7. Working model of ChP NKCC1 mediating K+-driven CSF outflow.
The schematics depict ChP NKCC1-mediated K+ and water clearance from CSF in neonatal mice, in comparison to the adult scenario. For simplicity and clarity, only K+ is depicted among all ions and only NKCC1 and Na+/K+-ATPase are included. Neonatal (P0-7, above) ChP has higher pNKCC1 expression than adult ChP, albeit lower total NKCC1. Neonatal CSF [K+] is 2–3 fold higher than adult. With similar [Na+] and [Cl], this [K+] difference is sufficient to alter the total Nernst potential of epithelial cells and bias NKCC1 transport of K+, together with water, out of CSF and into the ChP in neonates.

Similar articles

Cited by

References

    1. Fame RM, Lehtinen MK. Emergence and developmental roles of the cerebrospinal fluid system. Dev. Cell. 2020;52:261–275. doi: 10.1016/j.devcel.2020.01.027. - DOI - PubMed
    1. Kahle KT, Kulkarni AV, Limbrick DD, Jr., Warf BC. Hydrocephalus in children. Lancet. 2016;387:788–799. doi: 10.1016/S0140-6736(15)60694-8. - DOI - PubMed
    1. Vinchon M, Rekate H, Kulkarni AV. Pediatric hydrocephalus outcomes: a review. Fluids Barriers CNS. 2012;9:18. doi: 10.1186/2045-8118-9-18. - DOI - PMC - PubMed
    1. Steen RG, Mull C, McClure R, Hamer RM, Lieberman JA. Brain volume in first-episode schizophrenia: systematic review and meta-analysis of magnetic resonance imaging studies. Br. J. Psychiatry. 2006;188:510–518. doi: 10.1192/bjp.188.6.510. - DOI - PubMed
    1. Gilmore JH, et al. Prenatal and neonatal brain structure and white matter maturation in children at high risk for schizophrenia. Am. J. Psychiatry. 2010;167:1083–1091. doi: 10.1176/appi.ajp.2010.09101492. - DOI - PMC - PubMed

Publication types

MeSH terms

Substances