. 2021 Jan 19;12(1):462.
doi: 10.1038/s41467-020-20746-4.

Clostridioides difficile exploits toxin-mediated inflammation to alter the host nutritional landscape and exclude competitors from the gut microbiota

Affiliations

Clostridioides difficile exploits toxin-mediated inflammation to alter the host nutritional landscape and exclude competitors from the gut microbiota

Joshua R Fletcher et al. Nat Commun. .

Abstract

Clostridioides difficile is a bacterial pathogen that causes a range of clinical disease from mild to moderate diarrhea, pseudomembranous colitis, and toxic megacolon. Typically, C. difficile infections (CDIs) occur after antibiotic treatment, which alters the gut microbiota, decreasing colonization resistance against C. difficile. Disease is mediated by two large toxins and the expression of their genes is induced upon nutrient depletion via the alternative sigma factor TcdR. Here, we use tcdR mutants in two strains of C. difficile and omics to investigate how toxin-induced inflammation alters C. difficile metabolism, tissue gene expression and the gut microbiota, and to determine how inflammation by the host may be beneficial to C. difficile. We show that C. difficile metabolism is significantly different in the face of inflammation, with changes in many carbohydrate and amino acid uptake and utilization pathways. Host gene expression signatures suggest that degradation of collagen and other components of the extracellular matrix by matrix metalloproteinases is a major source of peptides and amino acids that supports C. difficile growth in vivo. Lastly, the inflammation induced by C. difficile toxin activity alters the gut microbiota, excluding members from the genus Bacteroides that are able to utilize the same essential nutrients released from collagen degradation.


Conflict of interest statement

C.M.T. consults for Vedanta Biosciences, Inc. and Summit Therapeutics.

Figures

Fig. 1
Fig. 1. Inflammation is attenuated in tcdR mice in a mouse model of C. difficile infection.
a Schematic depicting experimental design. All mice (n = 36) received the antibiotic cefoperazone in their drinking water. Subsets of mice were orally gavaged with C. difficile 630Δerm (wild type, n = 12) or C. difficile 630Δerm tcdR::ermB (tcdR, n = 12) via oral gavage after antibiotic treatment. A group of mice were only treated with the antibiotic (no C. diff or uninfected, n = 12). b C. difficile vegetative cell CFUs in feces (wild type n = 7 on day 2 and n = 6 on day 4; tcdR n = 8 on day 2 and n = 6 on day 4, *p = 0.0314). c C. difficile spore CFUs in the feces (wild type n = 8 on day 2 and n = 6 on day 4; tcdR n = 8 on day 2 and n = 6 on day 4). d Toxin activity in the cecal content of mice (wild type n = 6 on day 2 and n = 5 on day 4; tcdR n = 4 on day 2 and n = 5 on day 4). For wild type vs. tcdR on day 2, p = 0.0248. For wild type vs. tcdR on day 4, p = 0.02. e Histopathological summary scores of the cecum (n = 6 mice per group per day). f Representative images of H&E stained ceca from mice in e; scale bar, 500 μm. Arrow heads indicate epithelial damage. The H&E staining was performed on each mouse ceca. All data in (be) are presented as the mean and error bars indicate SEM. Kruskal–Wallis test with Dunn’s correction for multiple comparisons was used to test for statistical significance in (b), (c), and (d). Geissner-Greenhouse corrected ordinary Two-Way ANOVA with Tukey’s multiple comparisons test was used in (e).
Fig. 2
Fig. 2. Metabolic gene expression in C. difficile is significantly altered by toxin-mediated inflammation.
a Gene set enrichment analysis of the differentially expressed genes in vivo from wild type C. difficile relative to the tcdR mutant from both days 2 and 4. GO terms that had transcripts with decreased levels are depicted in black bars and GO terms containing transcripts with increased levels are shown as red bars. b Heatmap of the log2 fold change of key operons and transcripts that were called as differentially expressed by DESeq2 (log2 fold change ±1 and adjusted p < 0.05) in wild type C. difficile (n = 5 on day 2, n = 3 on day 4) relative to tcdR (n = 6 on day 2, n = 3 on day 4). The labels of known CodY-regulated transcripts (according to Dineen, et al. J Bacteriology 2010) are color-coded in red if they increased in expression in a codY mutant in vitro and green if they decreased.
Fig. 3
Fig. 3. C. difficile induces expression of numerous transcripts associated with inflammation and ECM degradation.
a Heatmap of the top 50 differentially regulated transcripts (by adj. p-value) in the ceca of uninfected control (no C. diff), wild type, and tcdR mice (n = 5–6 mice per group per day). b Gene set enrichment analysis of the differentially expressed genes in wild type mice relative to tcdR mice. c Log2 fold changes of various Mmps and associated transcripts from wild type vs. tcdR mouse ceca. Significance for all transcripts except Mmp3 was determined using differential expression analysis within the NanoString nSolver Advanced analysis software (log2 fold change ±1 and adjusted p < 0.05). Mmp3 expression levels were determined via qRT-PCR on cDNA generated from the same RNA used in the NanoString analysis, and individual data points can be seen in Supplementary Fig. 6c (Kruskal–Wallis with Dunn’s correction for multiple comparisons). *p < 0.05, **p < 0.01, ***p < 0.001, ****p < 0.0001.
Fig. 4
Fig. 4. Toxin-mediated degradation of collagen supports C. difficile growth in vitro.
a Representative images of DAPI (blue) and collagen (red) produced by IMR90 cells. Confluent cell monolayers were treated with 0.5 pM TcdA and TcdB and images were collected 12 h later. Collagen was stained with a mix of antibodies against collagen types I, III, and V in a 1:1:1 ratio; scale bar, 10 μm. b Mean fluorescent intensity of Alexa Fluor 568 stained collagen produced by IMR90 cells cultured in the presence or absence of 0.5 pM TcdA and TcdB for 15 h calculated using ImageJ software (n = 15 fields of view for each condition). Statistical significance was determined by Mann–Whitney rank-sum test; ****p < 0.0001. c C. difficile was grown in complete CDMM (n = 4), CDMM lacking proline (n = 4), or CDMM lacking proline and supplemented with heat-degraded collagen (n = 4). CFUs/ml were enumerated at 0 and 24 h; **p = 0.0051. Kruskal–Wallis test with Dunn’s correction for multiple comparisons was used to test for statistical significance. d C. difficile was grown in complete CDMM (n = 4), CDMM lacking proline (n = 4), or CDMM lacking proline supplemented with purified Pro-Gly (n = 4) or Gly-Pro (n = 4) dipeptides. 24 h CFUs were compared to the 0 h CFUs for statistical tests; **p = 0.0015, ****p < 0.0001. All data in (bd) are presented as the mean and error bars indicate SEM. Statistical significance was determined by two-way ANOVA with Sidak’s multiple comparisons test.
Fig. 5
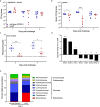
Fig. 5. C. difficile toxin activity suppresses the Bacteroidaceae that are able to compete with C. difficile for amino acids.
a Averaged percent relative abundance of Family level ASVs in each treatment group per timepoint. ASVs with less than 1% relative abundance in all samples were not included. b PCA biplot of 16S rRNA amplicon sequences derived from cecal tissue from uninfected or no C. diff control mice (n = 5 on day 2, n = 6 on day 4), wild type mice (n = 4 on day 2, n = 6 on day 4) and tcdR mice (n = 5 on day 2, n = 6 on day 4). Each colored symbol represents an individual mouse’s cecal microbiome, with circles being those from day 2 and triangles from day 4. 99% of OTUs are shown as gray crosses; the 10 OTUs furthest from the origin are labeled by the finest taxonomic rank identified (family, genus, or species). c 16 h fold change in CFUs of B. thetaiotaomicron in minimal media with (n = 3) or without glucose (n = 3), supplemented with either proline (n = 3) or hydroxyproline (n = 3) ****p = 0.0003, MM-Glucose vs. MM-Glucose+Pro; MM-Glucose vs. MM-Glucose+Pro, ***p = 0.0005; ****p < 0.0001. d 16 h fold change in CFUs of B. fragilis in identical media conditions as in (c) (n = 3 for each condition) ****p < 0.0001. All data in (c) and (d) are presented as the mean and error bars indicate the SEM. Statistical significance in (c) and (d) was determined by One-way ANOVA with Tukey’s multiple comparisons test.
Fig. 6
Fig. 6. C. difficile R20291 toxin activity similarly shapes the host gut transcriptome and microbiota community structure in mice.
a Total C. difficile CFUs (vegetative and spores) in feces over time (n = 8 mice for WT R20291 and n = 6 for or ΔtcdR mice; note that not every mouse provided a stool sample). b Fecal spore CFUs over time (n = 6–8 mice per group per day, *p = 0.0318). c Toxin activity in the cecal content of R20291 or ΔtcdR mice, as assessed by the Vero cell cytotoxicity assay (n = 5 mice per group on day 2, n = 4 mice per group on day 4, *p = 0.0383, **p = 0.0055). d Log2 fold change of Mmp and Timp expression (n = 3 mice per group) derived from NanoString transcriptome analysis (log2 fold change ±1 and adjusted p < 0.05). e Average percent relative abundances of 16S rRNA amplicon sequences from cecal tissue isolated at day 4 (n = 5 mice per group). One-way Kruskal–Wallis test with Dunn’s correction for multiple comparisons was used to test for statistical significance for (a) and (b). A mixed effects model with the Geissner-Greenhouse correction and Sidak’s multiple comparisons test was used for (c). Significance was determined in (d) by NanoString nSolver Advanced analysis software.

Similar articles

Cited by

References

    1. Lessa FC, Winston LG, McDonald LC, Emerging Infections Program C. difficile Surveillance Team. Burden of Clostridium difficile infection in the United States. N. Engl. J. Med. 2015;372:2369–2370. doi: 10.1056/NEJMoa1408913. - DOI - PMC - PubMed
    1. Aktories K, Schwan C, Jank T. Clostridium difficile toxin biology. Annu. Rev. Microbiol. 2017;71:281–307. doi: 10.1146/annurev-micro-090816-093458. - DOI - PubMed
    1. Winter SE, et al. Gut inflammation provides a respiratory electron acceptor for Salmonella. Nature. 2010;467:426–429. doi: 10.1038/nature09415. - DOI - PMC - PubMed
    1. Gillis CC, et al. Dysbiosis-associated change in host metabolism generates lactate to support salmonella growth. Cell Host Microbe. 2018;23:54–64.e6. doi: 10.1016/j.chom.2017.11.006. - DOI - PMC - PubMed
    1. Rivera-Chávez F, Mekalanos JJ. Cholera toxin promotes pathogen acquisition of host-derived nutrients. Nature. 2019;572:244–248. doi: 10.1038/s41586-019-1453-3. - DOI - PMC - PubMed

Publication types

MeSH terms

LinkOut - more resources