. 2021 Jan 19;12(1):435.
doi: 10.1038/s41467-020-20703-1.

Recruitment of upper-limb motoneurons with epidural electrical stimulation of the cervical spinal cord

Affiliations

Recruitment of upper-limb motoneurons with epidural electrical stimulation of the cervical spinal cord

Nathan Greiner et al. Nat Commun. .

Abstract

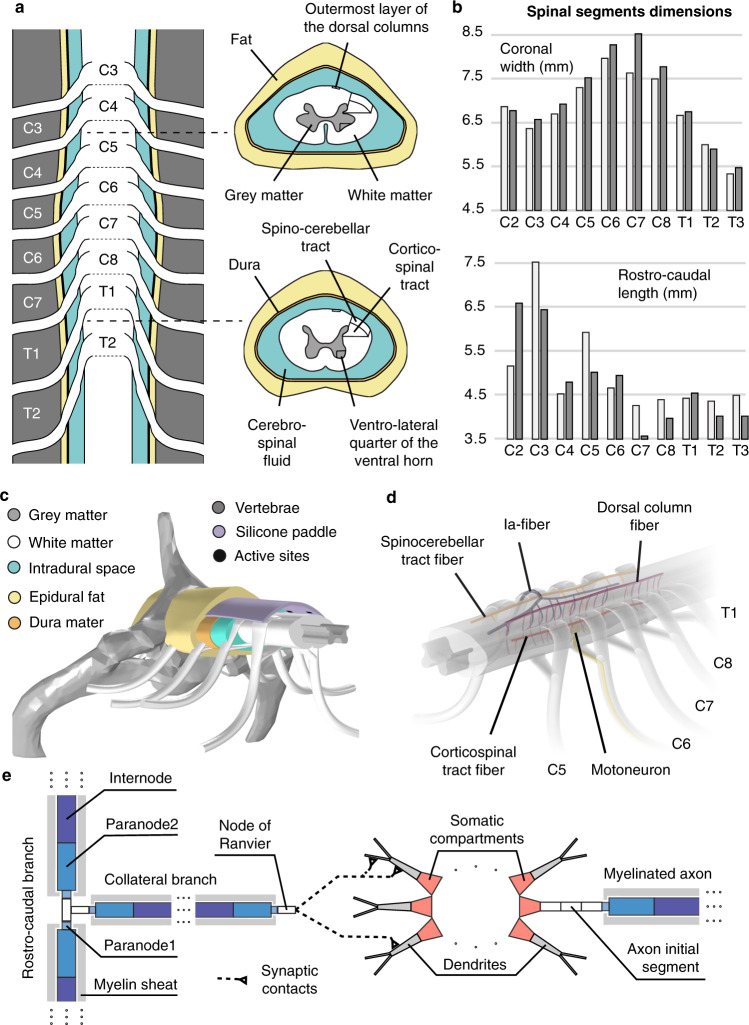
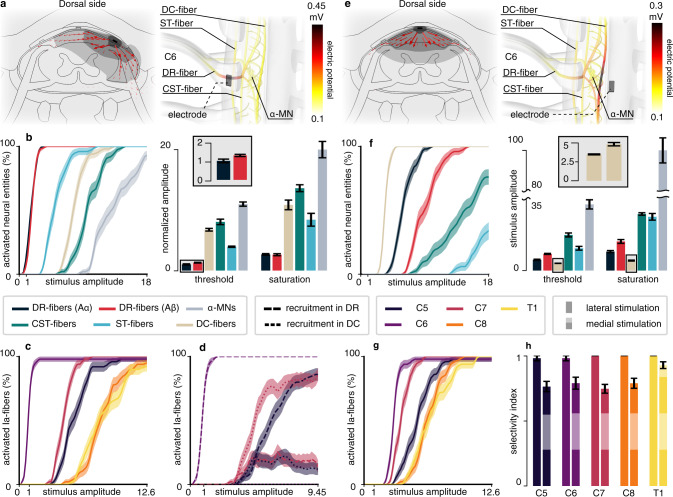
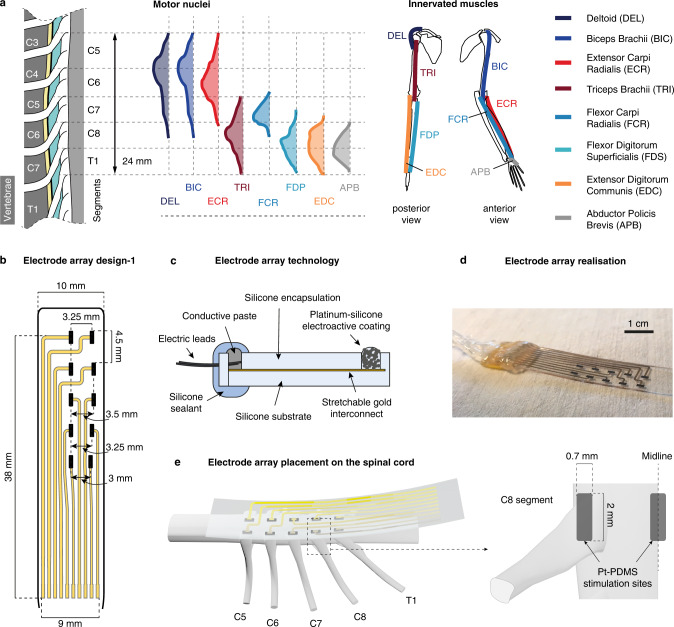
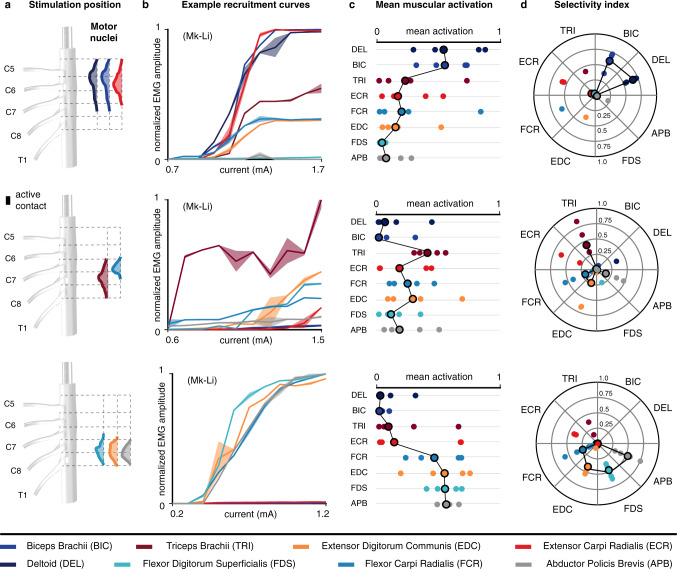
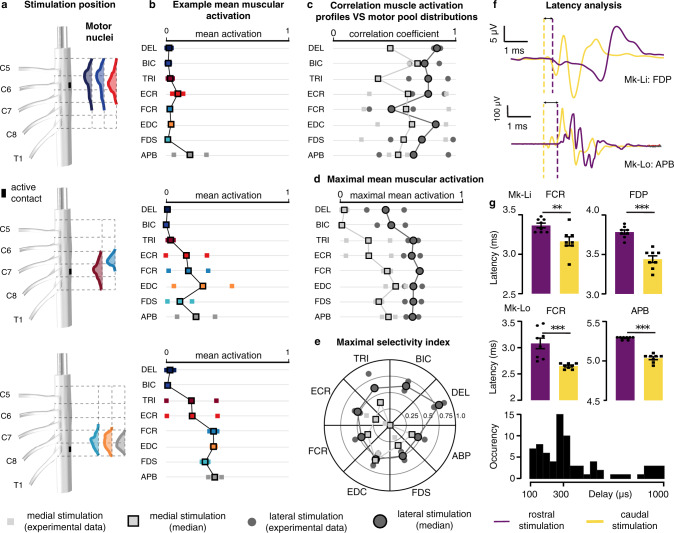
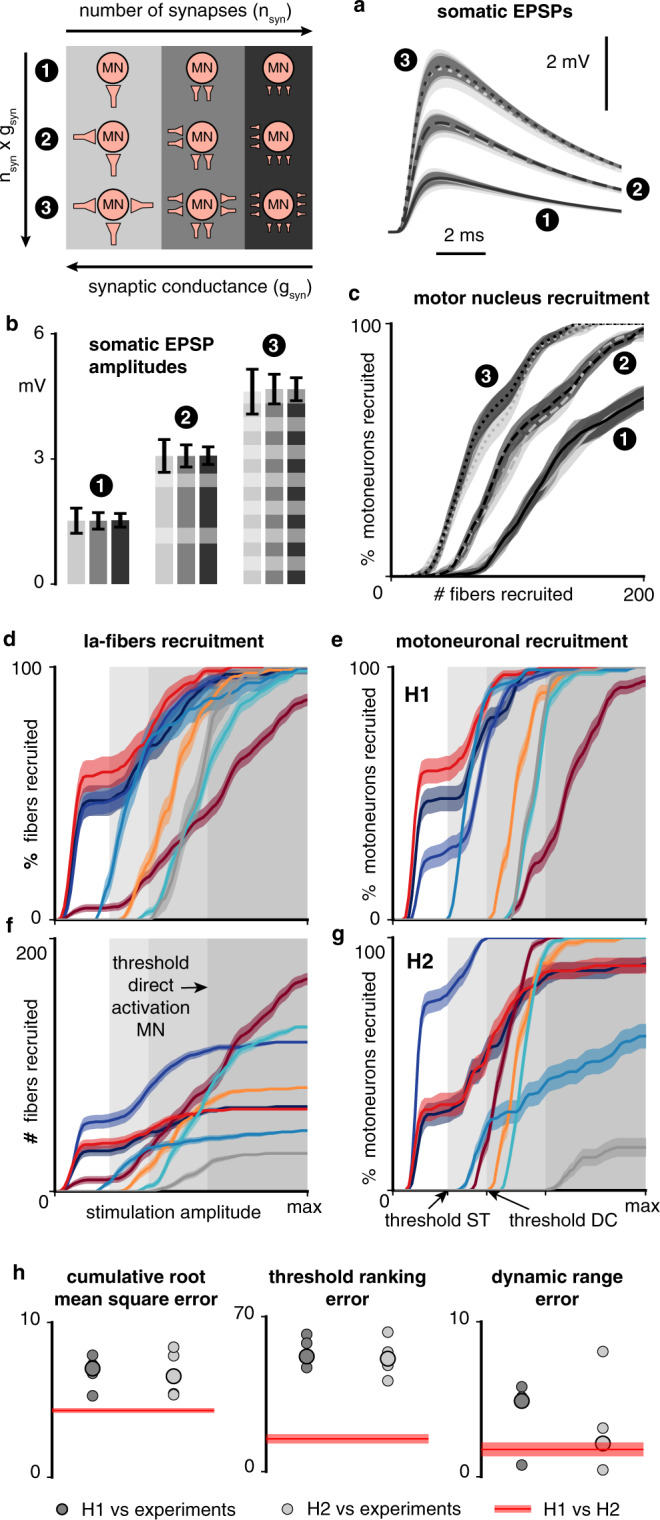
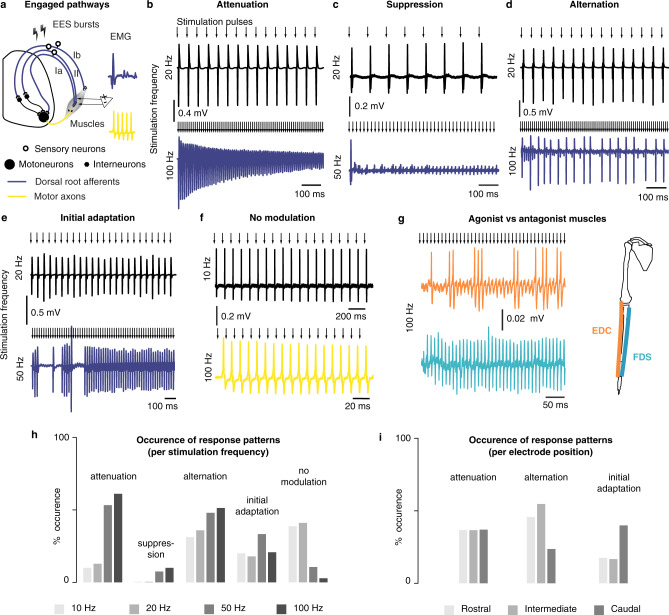
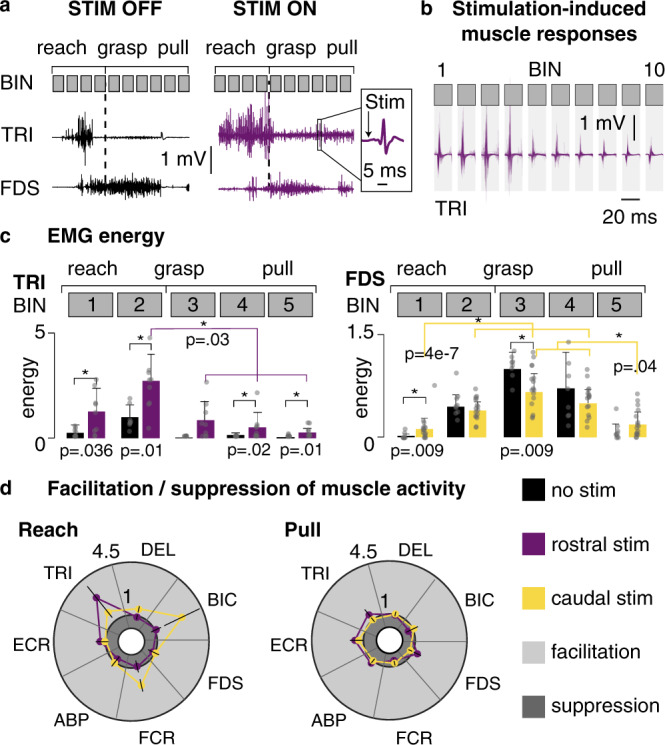
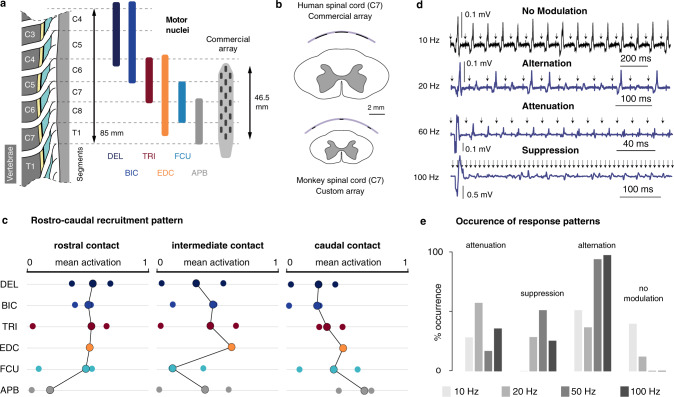
Epidural electrical stimulation (EES) of lumbosacral sensorimotor circuits improves leg motor control in animals and humans with spinal cord injury (SCI). Upper-limb motor control involves similar circuits, located in the cervical spinal cord, suggesting that EES could also improve arm and hand movements after quadriplegia. However, the ability of cervical EES to selectively modulate specific upper-limb motor nuclei remains unclear. Here, we combined a computational model of the cervical spinal cord with experiments in macaque monkeys to explore the mechanisms of upper-limb motoneuron recruitment with EES and characterize the selectivity of cervical interfaces. We show that lateral electrodes produce a segmental recruitment of arm motoneurons mediated by the direct activation of sensory afferents, and that muscle responses to EES are modulated during movement. Intraoperative recordings suggested similar properties in humans at rest. These modelling and experimental results can be applied for the development of neurotechnologies designed for the improvement of arm and hand control in humans with quadriplegia.


Conflict of interest statement

G.C., J.B., and S.L. are shareholders and founders of GTX medical, a company producing spinal cord stimulation technologies. G.C., J.B., M.C., B.B., and S.L. are inventors of multiple patent applications and granted patents covering parts of this work. All other authors declare no competing interests.

Figures

Fig. 1
Fig. 1. Morphology and computational model of the monkey cervical spinal cord.
a Macroscopic organization of the cervical spinal cord. Left: relationships between spinal segments, spinal roots, and vertebrae. Right: cross-sections at the C5 and T1 segmental levels showing the internal compartmentalization of the spinal cord. b Spinal segments dimensions. The two shades of gray indicate measurements coming from two different spinal cord dissections. c Tridimensional view of the volume conductor. d Trajectories of virtual nerve fibers and motoneurons. e Compartmentalization of myelinated nerve fibers and motoneurons used in neurophysical simulations,,.
Fig. 2
Fig. 2. Computational analysis of the direct targets of EES of the monkey cervical spinal cord.
a Electric currents and potential distribution (ϕ) generated by a lateral electrode contact at the C6 spinal level for a stimulation current of 1 μA estimated with the finite element method. Left: transversal cross-section cutting the electrode contact in two halves. Red arrows: current density vectors. Dark gray surface: ϕ ≥ 2 mV. Mild gray: ϕ ≥ 1 mV. Light gray: ϕ ≥ 0.8 mV. Right: ϕ along trajectories of virtual nerve fibers and motoneurons. DC: dorsal columns. ST: spinocerebellar tract. DR: dorsal root. CST: corticospinal tract. MN: motoneuron. b Direct recruitment of nerve fibers and motoneurons estimated from neurophysical simulations using the potential distribution of (a). Left: recruitment curves (dark blue and red curves are almost superimposed). Stimulus amplitudes are expressed as multiples of the threshold amplitude (10% recruitment) for DR-Aα-fibers. Right: threshold amplitudes and saturation amplitudes (90% recruitment) for the different neural entities, expressed as multiples of the threshold for DR-Aα-fibers. Inset: threshold for DR-Aα-fibers and DR-Aβ-fibers. c Simulated recruitment of Ia-fibers of individual dorsal roots using the potential distribution of (a). Amplitudes are expressed as multiples of the threshold for the Ia-fibers of the C6 root. d Recruitment for the C5, C6, and C7 roots split by recruitment localization. Amplitudes are expressed as multiples of the threshold for the Ia-fibers of the C6 root. e Same as (a) for a medially-positioned electrode contact. f Same as (b) with the potential distribution of (e). Inset: threshold and saturation amplitudes for the DC-fibers. Amplitudes are expressed as in (b). g Same as (c) with the potential distribution of (e). h Maximal selectivity indexes for each root using lateral or medial electrodes (see “Methods”). Recruitment curves (panels b [left], c, d, f [left], g): curves are made of 80 data points (except for d, 60 data points) consisting in the mean and standard deviation of the recruitment computed across 10,000 bootstrapped populations (see “Methods”). Lines and filled areas represent the moving average over three consecutive data points. Threshold, saturation, and selectivity bars and whiskers (panels b [right], f [right], h): mean ± standard deviation of the represented quantity computed across 10,000 bootstrapped populations (see “Methods”).
Fig. 3
Fig. 3. Organization of the monkey cervical spinal cord and soft electrode array tailored to the epidural space of the cervical spinal cord.
a Distribution of the motor nuclei of 8 upper-limb muscles in the monkey cervical spinal cord and skeletal positions of these upper-limb muscles. b Layout of a custom electrode array with 5 lateral and 5 medial electrode contacts (design-1) tailored to the monkey cervical spinal cord. c Cross-section diagram of a soft electrode array. d Photograph of a fabricated soft electrode array. Scale bar: 1 cm. e Placement of the electrode array relative to the cervical spinal cord. Lateral electrode contacts were made to face individual dorsal roots while medial contacts were made to be along the midline of the dorsal columns. Pt-PDMS: platinum-polydimethylsiloxane.
Fig. 4
Fig. 4. Muscular recruitment induced by laterally-positioned electrodes in the cervical spinal cord of monkeys.
a Approximate positions of the electrodes used to obtain the results in (bd) and underlying motoneuronal distributions. Electrode contacts are magnified for better visualization (scale factor: 2). b Examples of muscular recruitment curves observed in monkey Mk-Li using one rostral, one intermediately rostral, and one caudal electrodes. Curves are made of 11 data points consisting of the mean and standard deviation of the normalized peak-to-peak EMG amplitude across four responses induced at the same stimulation current. c Mean muscular activations observed in 5 monkeys. One rostral, one intermediately rostral and one caudal electrodes were chosen for each animal, and the observed mean muscular activations (see “Methods”) reported as individual bullets (for Mk-Li, the same active contacts as in (b) were used). d Maximal selectivity indexes (see “Methods”) obtained for each muscle and each animal with the same electrodes as in (c). Circled bullets: medians across the five animals.
Fig. 5
Fig. 5. Comparison of muscular recruitment profiles induced by lateral and medial electrodes.
a Approximate positions of the medial electrodes used to obtain the results in (b) and underlying motoneuronal distributions. Electrode contacts are magnified for better visualization (scale factor = 2). b Mean muscular activations obtained with the medial electrodes at the same rostro-caudal levels than the lateral electrodes of Fig. 4c for the 2 monkeys implanted with the design-1 array (see “Methods”). DEL: deltoid, BIC: biceps brachii, TRI: triceps brachii, FCR: flexor carpi radialis, FDS: flexor digitorum superficialis, ECR: extensor carpi radialis, EDC: extensor digitorum communis, APB: abductor pollicis brevis. c Correlation coefficients between muscular recruitment profiles and motor nuclei distributions (see “Methods”) for lateral and medial electrodes. d Maximal mean muscular activations achieved with lateral or with medial electrodes. e Maximal selectivity indexes (see “Methods”) achieved with lateral or medial electrodes. In be data points (small squares/circles without borders) may be hidden by medians (large squares/circles with black borders). f Examples of muscular response latencies following stimulation from rostral medial or caudal medial electrodes. Top: muscular responses recorded in the flexor digitorum profundis of monkey Mk-Li. Bottom: muscular responses recorded in the abductor policis brevis of monkey Mk-Lo. Onsets of responses are indicated by the vertical dashed lines. g Statistical analysis of the differences in onset latencies between rostrally-induced responses and caudally-induced responses (two-sided unpaired t-tests, **p < 0.01; ***p < 0.001, see “Methods”). For each muscle, eight responses induced at amplitudes near motor threshold with one rostral (purple) and one caudal (yellow) electrodes were retained. Bottom histogram: distribution of the delay of rostrally-induced responses compared to caudally-induced responses.
Fig. 6
Fig. 6. Computational analysis of the Ia-mediated recruitment of motoneurons.
a Time course of the somatic excitatory post-synaptic potential (EPSP) induced in a motoneuron model by various populations of synapses, for different population sizes nsyn and synaptic conductances gsyn. Lines (solid, dashed and dotted) and filled areas represent the mean and standard deviation of the EPSPs obtained with 100 random synapse populations for each condition (9 conditions in total, see legend in the top left corner and “Methods”). b Maximal amplitudes of the EPSPs of (a). Bars and whiskers: mean ± standard deviation computed across the 100 synapse populations for each condition. c Recruitment of a motor nucleus as a function of the number of simultaneously activated fibers innervating this motor nucleus, for different connectivity ratios and synaptic conductances. Higher connectivity ratios are indicated by higher numbers of synapses in the legend. d Recruitment of Ia-fibers of specific muscles following electrical stimulation from a lateral contact at the C6 spinal level (Fig. 2a). e Monosynaptic recruitment of motoneurons resulting from the Ia-fiber recruitment shown in (d) using muscle-specific synaptic conductances (hypothesis H1, see Supplementary Table 1). f Same Ia-fiber recruitment as in (d) but represented in absolute numbers of recruited fibers. g Same as (e) but using a uniform synaptic conductance of 7.625 pS (hypothesis H2). h Comparison between experimental muscular recruitment curves and simulated motoneuronal recruitment curves with H1 or H2 (see “Methods”). Each bullet represents the comparison score for one animal (5 animals in total). Circled bullets indicate the medians across the 5 animals. Simulated Ia-fiber and motoneuron recruitment curves (cg): curves are made of 80 data points (except for c, 40 data points) consisting in the mean and standard deviation of the recruitment computed across 10,000 bootstrapped populations (see “Methods”). Lines and filled areas represent the moving average over three consecutive data points.
Fig. 7
Fig. 7. Patterns of muscular responses elicited during high-frequency stimulation of the cervical spinal cord of monkeys.
a Diagram of the presumed engaged pathways during high-frequency stimulation when muscular responses are modulated and unmodulated, respectively. be Examples of frequency-dependent modulation of muscular responses. In each panel, the top and bottom EMG traces were recorded in the same muscle and using the same stimulation amplitude (near motor threshold) but different frequencies. f Example of absence of frequency-dependent modulation. g Example of absence of correlation of frequency-dependent modulation between antagonist muscles (the top and bottom traces are simultaneous recordings of the extensor digitorum communis (EDC) and flexor digitorum superficialis (FDS) muscles of Mk-Lo during the same stimulation pulse train). h Frequency of occurrence of modulation patterns with respect to stimulation frequency. All the patterns recorded in all the muscles of the 4 animals in which high-frequency stimulation was tested were included in the analysis (n = 80 patterns at 10 Hz, n = 39 patterns at 20 Hz, n = 75 patterns at 50 Hz, n = 72 patterns at 100 Hz). i Same as (h), but with respect to electrode position (n = 132 patterns for rostral electrodes, n = 66 patterns for intermediate electrodes, and n = 68 patterns for caudal electrodes).
Fig. 8
Fig. 8. Effects of continuous stimulation during voluntary movement.
a Example of EMG activity during a reach, grasp and pull task. Left: without stimulation. Right: with stimulation. Top gray squares: division of time into 10 equal bins (used in b). Inset: typical stimulation-induced muscle response. TRI: triceps. FDS: flexor digitorum superficialis. b Overlay of stimulation-induced muscle responses in the triceps muscle during task execution. For multiple task executions (each divided in 10 bins as in a) and for each bin, the 20 ms windows of EMG data following each stimulation pulse occurring in the bin were extracted and overlaid (301 superimposed responses per bin). c EMG energy of the TRI (left) and FDS (right) muscles during task execution. Black: without stimulation. Purple: with rostral stimulation. Yellow: with caudal stimulation. Bars and whiskers: mean and standard deviation of the EMG energy across multiple task executions (rostral stim: 9 trials; caudal stim: 16 trials; baseline: 9 trials). For each trial, time was divided into 5 bins, and the EMG energy computed in each bin (see “Methods”). Statistics: Black: Wilcoxon Rank-Sum tests. Purple/yellow: Kruskal–Wallis tests analyzed post-hoc with Tukey–Kramer tests. Both: *p < 0.05 (see “Methods”). For TRI, energy is expressed in multiples of the baseline energy (i.e., without stimulation) during BIN 2. For FDS, energy is expressed in multiples of the baseline energy during BIN 3. d Mean facilitation indexes (dimensionless) of 7 upper-limb muscles (see “Methods”). Left: during reach. Right: during pull. Values greater than 1 indicate a facilitation effect; values smaller than 1 indicate suppression. DEL: deltoid, BIC: biceps, FCR: flexor carpi radialis, ECR: extensor carpi radialis, EDC: extensor digitorum communis, APB: abductor pollicis brevis.
Fig. 9
Fig. 9. Muscular activity patterns evoked by EES of the cervical spinal cord in humans.
a Dimensions of the human cervical spinal segments, heuristic distribution of the motor nuclei of 6 upper-limb muscles, and sketch of the commercial paddle epidural electrode array used in 3 human patients. DEL: deltoid, BIC: biceps, TRI: triceps, EDC: extensor digitorum communis, FCU: flexor carpi ulnaris, APB: abductor pollicis brevis. b Comparison between the relative dimensions of the monkey cervical spinal cord and our custom implant, and the human cervical spinal cord and the commercial epidural implant of (a). c Mean muscular activations observed in 5 patients. One rostral, one caudal and one intermediate sites of stimulation (all lateral) were chosen for each patient, and the observed mean muscular activations (see “Methods”) reported as individual bullets. For EDC, only 2 patients available. For FCU: only 3. Circled connected bullets: medians across the patients. d Examples of frequency-dependent modulation of muscular responses. The 4 EMG traces were obtained in the same muscle, using the same stimulation amplitude (near motor threshold) but different frequencies. Arrows: timestamps of stimulation pulses. e Frequency of occurrence of muscular response patterns during high-frequency stimulation. All the patterns recorded in all the muscles of the 3 subjects were included in the analysis (n = 24 patterns at 10 Hz, n = 32 patterns at 20 Hz, n = 32 patterns at 60 Hz, n = 24 patterns at 100 Hz).

Similar articles

Cited by

References

    1. Angeli CA, et al. Recovery of over-ground walking after chronic motor complete spinal cord injury. N. Engl. J. Med. 2018;379:1244–1250. doi: 10.1056/NEJMoa1803588. - DOI - PubMed
    1. van den Brand R, et al. Restoring voluntary control of locomotion after paralyzing spinal cord injury. Science. 2012;336:1182–1185. doi: 10.1126/science.1217416. - DOI - PubMed
    1. Capogrosso M, et al. A brain-spine interface alleviating gait deficits after spinal cord injury in primates. Nature. 2016;539:284–288. doi: 10.1038/nature20118. - DOI - PMC - PubMed
    1. Courtine G, et al. Transformation of nonfunctional spinal circuits into functional states after the loss of brain input. Nat. Neurosci. 2009;12:1333–1342. doi: 10.1038/nn.2401. - DOI - PMC - PubMed
    1. Gill ML, et al. Neuromodulation of lumbosacral spinal networks enables independent stepping after complete paraplegia. Nat. Med. 2018;24:1677–1682. doi: 10.1038/s41591-018-0175-7. - DOI - PubMed

Publication types

MeSH terms