. 2021 Jan 19;7(1):5.
doi: 10.1038/s41522-020-00176-2.

Host development overwhelms environmental dispersal in governing the ecological succession of zebrafish gut microbiota

Affiliations

Host development overwhelms environmental dispersal in governing the ecological succession of zebrafish gut microbiota

Fanshu Xiao et al. NPJ Biofilms Microbiomes. .

Abstract

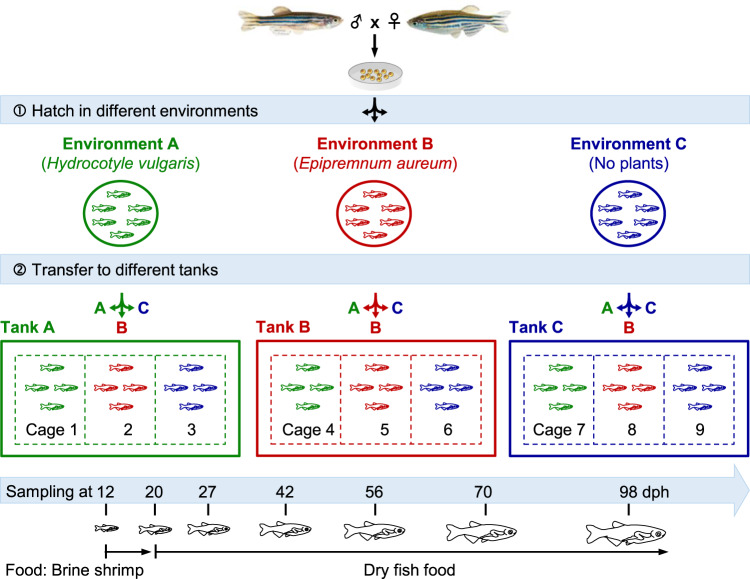
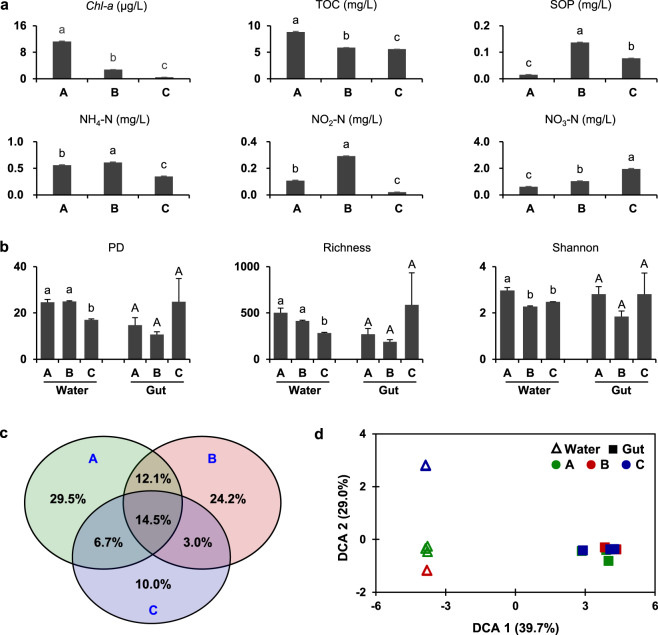
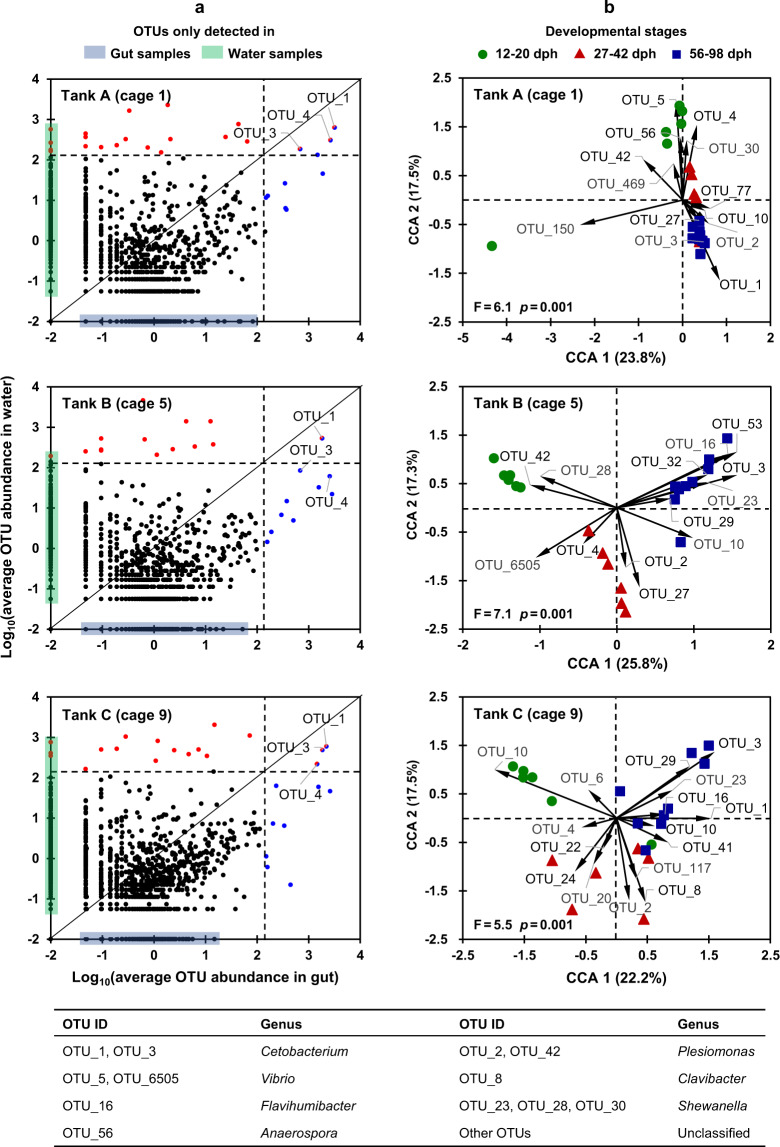
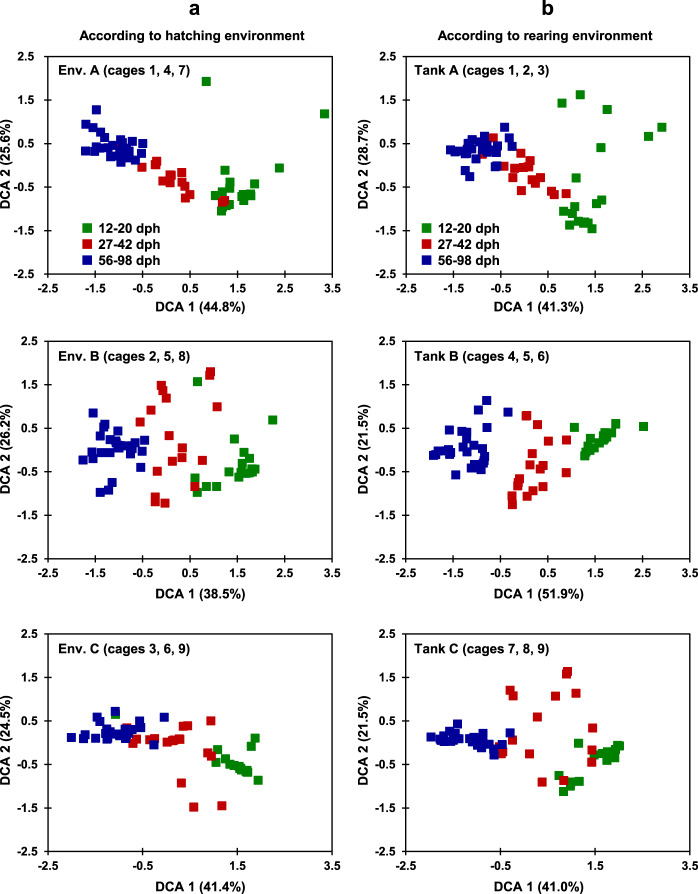
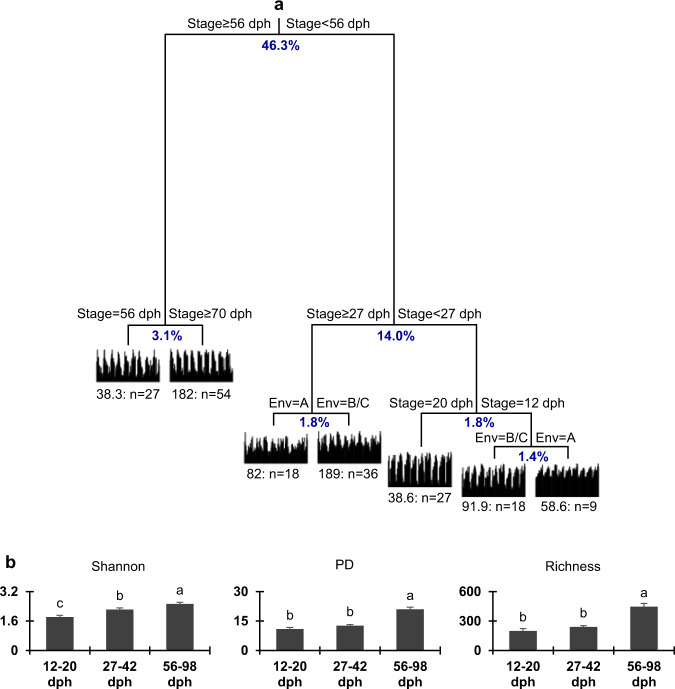
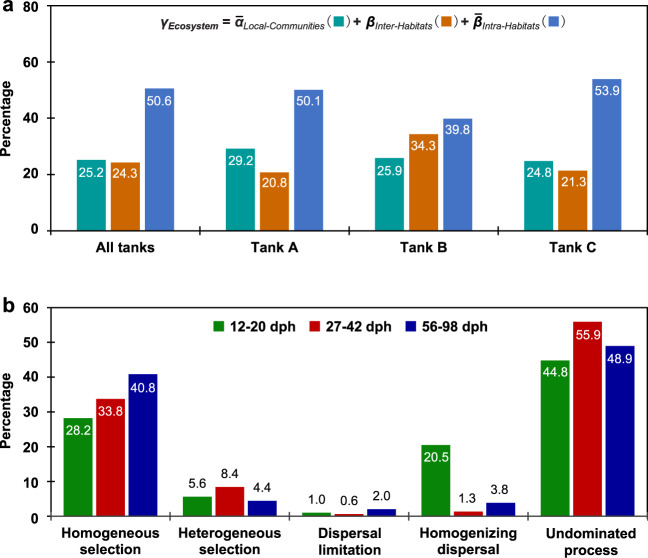
Clarifying mechanisms underlying the ecological succession of gut microbiota is a central theme of gut ecology. Under experimental manipulations of zebrafish hatching and rearing environments, we test our core hypothesis that the host development will overwhelm environmental dispersal in governing fish gut microbial community succession due to host genetics, immunology, and gut nutrient niches. We find that zebrafish developmental stage substantially explains the gut microbial community succession, whereas the environmental effects do not significantly affect the gut microbiota succession from larvae to adult fish. The gut microbiotas of zebrafish are clearly separated according to fish developmental stages, and the degree of homogeneous selection governing gut microbiota succession is increasing with host development. This study advances our mechanistic understanding of the gut microbiota assembly and succession by integrating the host and environmental effects, which also provides new insights into the gut ecology of other aquatic animals.


Conflict of interest statement

The authors declare no competing interests.

Figures

Fig. 1
Fig. 1. Experimental setup for testing host and environmental effects on the ecological succession of gut microbiota across zebrafish development.
Zebrafish were manipulated under three different environments (A, B, and C). First, zebrafish embryos belong to a single sibship were hatched in three independent circular plates with water from environments A, B, and C, respectively. Second, zebrafish hatched from different environments (indicated by green, red, and blue, respectively) were transferred from plates to tanks at 12 days post-hatching (dph) and raised in small net cages (dotted box). Gut samples were collected from different cages across zebrafish development from 12 to 98 dph. The colored lines, fish and letters in green, red, and blue corresponding to environments A, B, and C, respectively. Cages 1, 5, 9 represented zebrafish kept in original environments, and the other cages represented zebrafish subjected to switched environments.
Fig. 2
Fig. 2. Chemical and microbial characteristics of the three constructed water environments and zebrafish gut microbiota colonized at 12 dph.
a Chemical factors of water. Mean values were plotted with standard errors, and the variation among environments were tested through an ANOVA with least-significant-difference (LSD) tests. The presence of different letters denoted significant differences among environments, and the same letter indicated no significant difference. Chl-a Chlorophyll a, SOP soluble orthophosphate, TOC total organic carbon. b alpha-diversity of water and gut microbiotas. PD phylogenetic diversity. c Venn diagram of water microbiotas. The Venn diagram represent proportions of shared OTUs (operational taxonomic units) across environments over the total number of OTUs detected in all environments, but it does not provide quantitative data on the OTUs. d detrended correspondence analysis showing the dissimilarity of water and gut microbiotas at 12 dph (days post-hatching).
Fig. 3
Fig. 3. The average abundance for each detected OTU and the variation of gut microbial communities explained by the top 20 OTUs.
a the average abundance for each OTU across water and gut microbiotas. The microbial OTUs that were equally abundant in gut and water samples fall along the diagonal line, whereas those enriched in the water or gut samples fall above or below the line, respectively. Dashed lines marked 1% of the average abundance in water or gut samples, respectively. The OTUs averagely >1% in gut or water samples are shown in blue and red, respectively. The red and blue mix points indicate OTUs dominated in both gut and water microbiotas, and the black points indicate OTUs averagely <1% in gut or water samples. b canonical correspondence analysis (CCA) showing gut microbiota variation explained by the top 20 OTUs. Each point represents a gut microbial community of individual zebrafish, and arrows represent the contribution of the top 20 bacterial OTUs.
Fig. 4
Fig. 4. Detrended correspondence analysis (DCA) showing environmental effects on the succession of gut microbiota across zebrafish development.
a According to hatching environment. b According to rearing environment. Zebrafish hatched from different environments (Env.) or raised in different environments showed similar gut microbial succession patterns across host development.
Fig. 5
Fig. 5. Zebrafish gut microbial diversity mainly associated with the developmental stage.
a the multivariate regression tree (MRT) analysis performed base on the Bray-Curtis distance with interactions of different factors (i.e., developmental stage, environment, transition and food). b alpha-diversity of Shannon, phylogenetic diversity (PD), and richness were plotted with standard errors. The variations among environments were tested through an ANOVA with least-significant-difference (LSD) tests. The presence of different letters denotes significant differences among environments, and the same letter indicates no significant difference.
Fig. 6
Fig. 6. The quantification of metacommunity diversity and ecological processes.
a hierarchical partitioning of the metacommunity diversity at multiscale. The ecosystem diversity (γEcosystem) of each tank or across all tanks was partitioned into contributions of αLocal-Communities (mean diversity of each water or gut sample), βIntra-Habitats (mean of diversity within water or gut habitats), and βInter-Habitats (sum of diversity between water and gut habitats). b the quantified major ecological processes governing the gut microbial communities. The percentages (numbers on the individual bars) are given the relative contribution of each known process to the community succession at different stages, and the remaining parts attributed to undominated process.

References

    1. Chang CC, Turner BL. Ecological succession in a changing world. J. Ecol. 2019;107:503–509. doi: 10.1111/1365-2745.13132. - DOI
    1. Ringø E, et al. Effect of dietary components on the gut microbiota of aquatic animals. A never-ending story? Aquac. Nutr. 2016;22:219–282. doi: 10.1111/anu.12346. - DOI
    1. Holt CC, van der Giezen M, Daniels CL, Stentiford GD, Bass D. Spatial and temporal axes impact ecology of the gut microbiome in juvenile European lobster (Homarus gammarus) ISME J. 2020;14:531–543. doi: 10.1038/s41396-019-0546-1. - DOI - PMC - PubMed
    1. Wong S, Rawls JF. Intestinal microbiota composition in fishes is influenced by host ecology and environment. Mol. Ecol. 2012;21:3100–3102. doi: 10.1111/j.1365-294X.2012.05646.x. - DOI - PMC - PubMed
    1. Wilkins LGE, Fumagalli L, Wedekind C. Effects of host genetics and environment on egg-associated microbiotas in brown trout (Salmo trutta) Mol. Ecol. 2016;25:4930–4945. doi: 10.1111/mec.13798. - DOI - PubMed

Publication types

LinkOut - more resources