. 2021 Jan 19;12(1):440.
doi: 10.1038/s41467-020-20723-x.

Boosting anti-PD-1 therapy with metformin-loaded macrophage-derived microparticles

Affiliations

Boosting anti-PD-1 therapy with metformin-loaded macrophage-derived microparticles

Zhaohan Wei et al. Nat Commun. .

Abstract

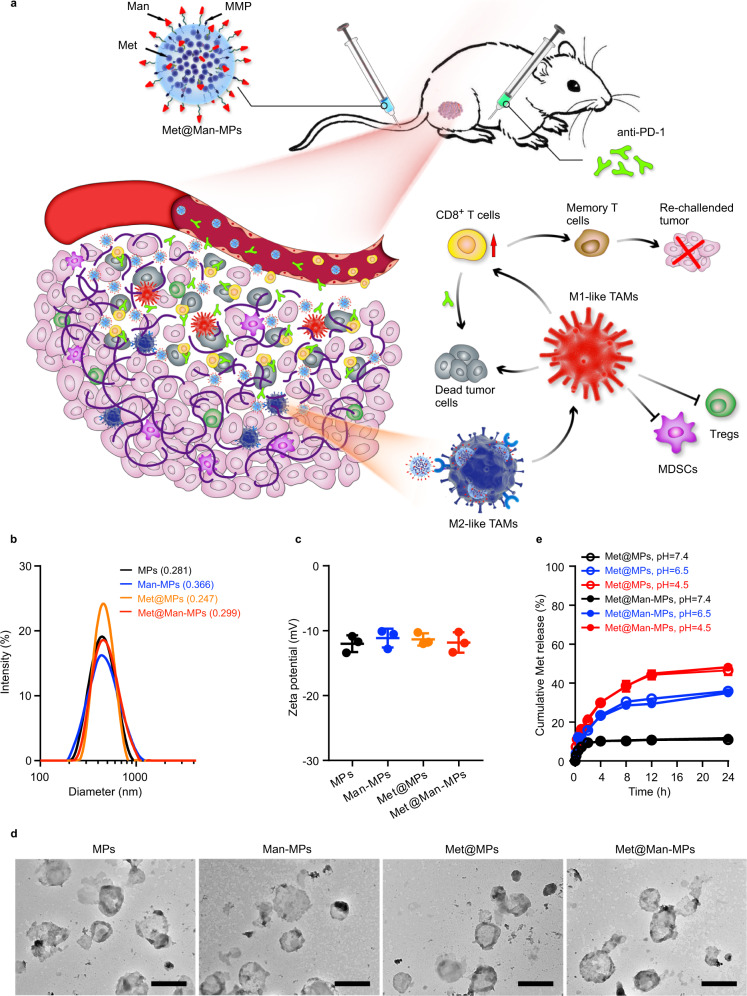
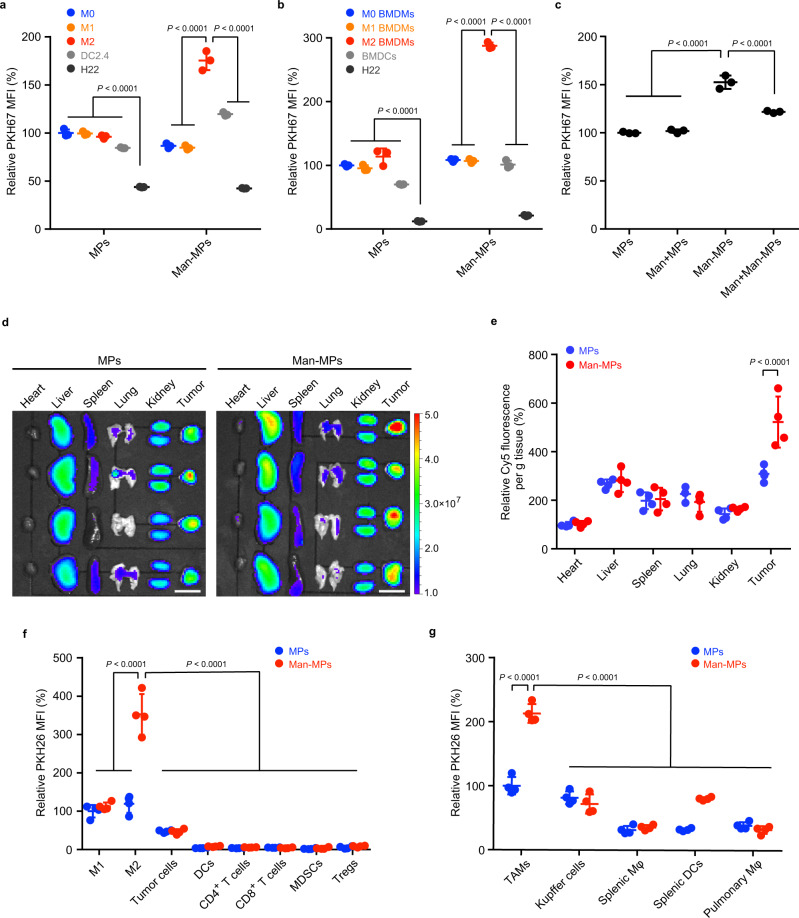
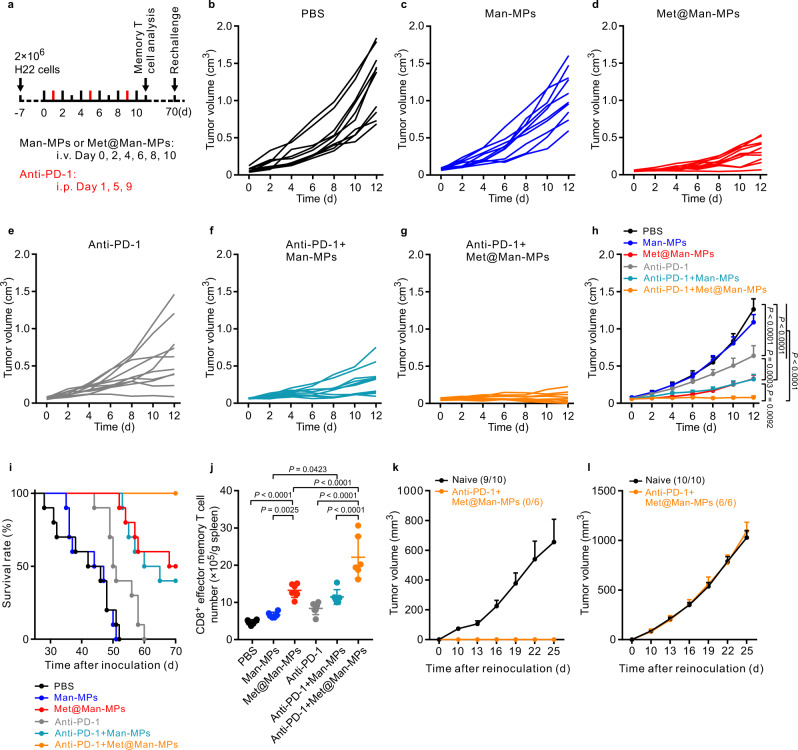
The main challenges for programmed cell death 1(PD-1)/PD-1 ligand (PD-L1) checkpoint blockade lie in a lack of sufficient T cell infiltration, tumor immunosuppressive microenvironment, and the inadequate tumor accumulation and penetration of anti-PD-1/PD-L1 antibody. Resetting tumor-associated macrophages (TAMs) is a promising strategy to enhance T-cell antitumor immunity and ameliorate tumor immunosuppression. Here, mannose-modified macrophage-derived microparticles (Man-MPs) loading metformin (Met@Man-MPs) are developed to efficiently target to M2-like TAMs to repolarize into M1-like phenotype. Met@Man-MPs-reset TAMs remodel the tumor immune microenvironment by increasing the recruitment of CD8+ T cells into tumor tissues and decreasing immunosuppressive infiltration of myeloid-derived suppressor cells and regulatory T cells. More importantly, the collagen-degrading capacity of Man-MPs contributes to the infiltration of CD8+ T cells into tumor interiors and enhances tumor accumulation and penetration of anti-PD-1 antibody. These unique features of Met@Man-MPs contribute to boost anti-PD-1 antibody therapy, improving anticancer efficacy and long-term memory immunity after combination treatment. Our results support Met@Man-MPs as a potential drug to improve tumor resistance to anti-PD-1 therapy.


Conflict of interest statement

The authors declare no competing interests.

Figures

Fig. 1
Fig. 1. Characterization of Met@Man-MPs.
a Schematic of Met@Man-MPs as an efficient drug to boost anti-PD-1 therapy. Met@Man-MPs with MMP activity efficiently target to M2-like TAMs and degrade tumor collagen. (1) Met@Man-MPs repolarize M2-like TAMs to M1-like phenotype, resulting in the recruitment of CD8+ T cells into tumor tissues and the ameliorated tumor immunosuppressive microenvironment. (2) Collagen-degrading capacity of Man-MPs contributes to the infiltration of CD8+ T cells into tumor interiors and enhances tumor accumulation and penetration of anti-PD-1 antibody. (3) Met@Man-MPs synergistically inhibit tumor growth in combination with anti-PD-1 antibody, generating long-term memory immunity. b Hydrodynamic diameters of MPs and Man-MPs with or without Met by DLS analysis. Polydispersity index values are indicated in the brackets. c Zeta potentials of MPs and Man-MPs with or without Met by DLS analysis. Data are presented as means ± s.d. (n = 3 independent samples). d Morphology of MPs and Man-MPs with or without Met by TEM. Images are representative of three independent experiments. Scale bars: 500 nm. e Drug release of Met@MPs and Met@Man-MPs in PBS at different pH values. Data are presented as means ± s.d. (n = 3 independent samples). Source data are provided as a Source Data file.
Fig. 2
Fig. 2. M2-like TAM-targeting capacity of Man-MPs.
a, b Relative PKH67 mean fluorescence intensity (MFI) in RAW264.7 cells (M0 macrophages, a) or BMDMs (M0 BMDMs, b), LPS- and IFN-γ-conditioned RAW264.7 cells (M1-like macrophages, a) or BMDMs (M1-like BMDMs, b), IL-4-conditioned RAW264.7 cells (M2-like macrophages, a) or BMDMs (M2-like BMDMs, b), dendritic DC2.4 cells (a) or bone marrow-derived dendritic cells (BMDCs, b) and H22 cells after treatment with PKH67-labeled MPs or Man-MPs at the concentration of 10 µg protein mL−1 for 4 h. Data are presented as means ± s.d. (n = 3 biologically independent samples; one-way ANOVA followed by Tukey’s HSD post-hoc test). c Relative PKH67 MFI in IL-4-conditioned RAW264.7 cells after treatment with PKH67-labeled MPs or Man-MPs at the concentration of 10 µg protein mL−1 in the presence or absence of 100 μg mL−1 Man for 4 h. Data are presented as means ± s.d. (n = 3 biologically independent samples; one-way ANOVA followed by Tukey’s HSD post-hoc test). d, e, Ex vivo imaging (d) and fluorescence intensity (e) of Cy5 in the organs and tumors of H22 tumor-bearing mice at 24 h after intravenous injection of Cy5-labeled MPs or Man-MPs at the dosage of 15 mg protein kg−1. Scale bars: 1 cm for (d). Data are presented as means ± s.d. for (e). (n = 4 mice per group; unpaired two-tailed Student’s t-test). f Relative PKH26 MFI in M1-like TAMs (CD11b+F4/80+CD11c+ cells), M2-like TAMs (CD11b+F4/80+CD206+ cells), GFP+ tumor cells, DCs (CD45+F4/80CD11c+ cells), CD4+ T cells (CD45+CD3+CD4+ cells), CD8+ T cells (CD45+CD3+CD8a+ cells), MDSCs (CD45+CD11b+Gr1+ cells) and Tregs (CD45+CD4+CD25+FoxP3+ cells) in tumor tissues of GFP-expressing H22 tumor-bearing mice at 24 h after intravenous injeciton of PKH26-labeled MPs or Man-MPs at the dosage of 15 mg protein kg−1. Data are presented as means ± s.d. (n = 4 mice per group; two-way ANOVA followed by Bonferroni’s multiple comparisons post-test). g Relative PKH26 MFI in TAMs, liver Kupffer cells, splenic macrophages, pulmonary macrophages (all these macrophages including TAMs were gated as CD11b+F4/80+ cells) and splenic DCs (CD45+F4/80CD11c+ cells) of H22 tumor-bearing mice at 24 h after treatment indicated in (f). Data are presented as means ± s.d. (n = 4 mice per group; two-way ANOVA followed by Bonferroni’s multiple comparisons post-test). Source data are provided as a Source Data file.
Fig. 3
Fig. 3. Repolarization of M2-like macrophages to M1 phenotype by Met@Man-MPs.
ae mRNA expression levels of TNFα (a), iNOS (b), Mrc1 (c), Mgl1 (d), and Arg1 (e) in IL-4-conditioned RAW264.7 cells after treatment with PBS, MPs, Man-MPs, free Met, Met@MPs or Met@Man-MPs derived from RAW264.7 cells at the Met concentration of 20 μg mL−1, or high concentration of Met at 200 μg mL−1 for 24 h by real-time RT-PCR. Data are presented as means ± s.d. (n = 4 biologically independent samples; one-way ANOVA followed by Tukey’s HSD post-hoc test). fh Cell viability of H22 (f), 4T1 (g), and HepG2 cells (h) after treatment with the supernatants of IL-4-conditioned RAW264.7 cells pretreated with PBS, MPs, Man-MPs, free Met, Met@MPs or Met@Man-MPs derived from RAW264.7 cells at the Met concentration of 20 μg mL−1, or high dosage of free Met at 200 μg mL−1 for 24 h. Data are presented as means ± s.d. (n = 4 biologically independent samples; one-way ANOVA followed by Tukey’s HSD post-hoc test). i Tumor formation in BALB/c mice after subcutaneous co-implantation of H22 cells (8 × 105 cells per mouse) and IL-4-conditioned RAW264.7 cells pretreated with PBS, MPs, Man-MPs, free Met, Met@MPs or Met@Man-MPs derived from RAW264.7 cells at the Met concentration of 20 μg mL−1, or high dosage of free Met at 200 μg mL−1 for 24 h at a ratio of 1:2 into the flanks of BALB/c mice (n = 8 mice per group). j Tumor volume in BALB/c mice after treatment indicated in (i). Data are presented as means ± s.e.m. (n = 8 mice per group; two-way ANOVA followed by Bonferroni’s multiple comparisons post-test). k Tumor weight at the end of treatment indicated in (i). Data are presented as means ± s.d. (n = 8 mice per group; one-way ANOVA followed by Tukey’s HSD post-hoc test). Source data are provided as a Source Data file.
Fig. 4
Fig. 4. Anticancer activity and improved immune microenvironment of Met@Man-MPs in H22 tumor-bearing mice.
a Tumor growth curves of H22 tumor-bearing mice after intravenous injection of PBS, MPs, Man-MPs, free Met, Met@MPs or Met@Man-MPs at the Met dosage of 10 mg kg−1, or high dosage of Met at 100 mg kg−1 every two days for six times. The black arrows indicate the injection time. Data are presented as mean ± s.e.m. (n = 5 mice per group; two-way ANOVA followed by Bonferroni’s multiple comparisons post-test). b Tumor weight at the end of the treatment indicated in (a). Data are presented as mean ± s.d. (n = 5 mice per group; one-way ANOVA followed by Tukey’s HSD post-hoc test). c Kaplan–Meier survival plot of H22 tumor-bearing mice after treatment indicated in (a) (n = 7 mice per group). dk The numbers of M1-like TAMs (d), M2-like TAMs (e), CD8+ T cells (f), CD8+CD69+ T cells (g), CD4+ T cells (h), CD4+CD69+ T cells (i), MDSCs (j), and Tregs (k) in tumor tissues of H22 tumor-bearing mice after intravenous injection of PBS, MPs, Man-MPs, free Met, Met@MPs or Met@Man-MPs at the Met dosage of 10 mg kg−1, or high dosage of Met at 100 mg kg−1 every two days for six times. Data are presented as mean  ± s.d. (n = 3 mice per group; one-way ANOVA followed by Tukey’s HSD post-hoc test). lo The contents of IFN-γ (l), TNF-α (m), IL12p70 (n), and TGF-β (o) in tumor tissues of H22 tumor-bearing mice after intravenous injection of PBS, MPs, Man-MPs, free Met, Met@MPs or Met@Man-MPs at Met dosage of 10 mg kg−1, or high dosage of Met at 100 mg kg−1 every two days for six times. Data are presented as mean ±  s.d. (n = 3 mice per group; one-way ANOVA followed by Tukey’s HSD post-hoc test). Source data are provided as a Source Data file.
Fig. 5
Fig. 5. Collagen-degrading capacity of Man-MPs.
a Relative collagen content after soluble collagen I was incubated with MPs or Man-MPs at the concentration of 75 µg protein mL−1 pretreated with or without 0.6 mg mL−1 Bati or 100 μg mL−1 AEBSF for 72 h measured by Sirius red total collagen detection kit. Data are presented as mean ± s.d. (n = 3 biologically independent samples; one-way ANOVA followed by Tukey’s HSD post-hoc test). b SHG imaging of tumor tissues of H22 tumor-bearing mice after intravenous injection of PBS, MPs, Man-MPs, free Met, Met@MPs or Met@Man-MPs at the Met dosage of 10 mg kg−1, or high dosage of Met at 100 mg kg−1 every two days for different times. Images are representative of three biologically independent mice. Scale bars: 50 μm. c Relative SHG signal intensity in tumor tissues of H22 tumor-bearing mice after treatment indicated in (b). Data are presented as mean ± s.d. (n = 10 fields for 3 mice; two-way ANOVA followed by Bonferroni’s multiple comparisons post-test). d Immunofluorescence analysis of collagen I (labeled with Cy3-conjugated collage I antibody, red) in tumor tissues of H22 tumor-bearing mice after intravenous injection of PBS, MPs, Man-MPs, free Met, Met@MPs or Met@Man-MPs at the Met dosage of 10 mg kg−1, or high dosage of Met at 100 mg kg−1 every two days for six times. The nuclei were stained by DAPI (blue). Images are representative of three biologically independent mice. Scale bars: 200 μm. e Relative collagen I-positive area in tumor tissues of H22 tumor-bearing mice after treatment indicated in (d). Data are presented as mean ± s.d. (n = 5 fields for 3 mice; one-way ANOVA followed by Tukey’s HSD post-hoc test). Source data are provided as a Source Data file.
Fig. 6
Fig. 6. Met@Man-MPs-induced CD8+ T cell tumor infiltration by recruiting CD8+ T cells and degrading tumor ECM.
a Schematic schedule for Met@Man-MPs-induced CD8+ T cell tumor infiltration analysis in H22 tumor-bearing mice. b Fluorescence images of CD8+ T cells (labeling with Cy3-conjugated CD8 antibody, red) in the tumor tissues of H22 tumor-bearing mice after intravenous injection of Met@Man-MPs pretreated with or without Bati (0.6 mg mL−1) at the Met dosage of 10 mg kg−1 every two days for six times, or/and intraperitoneal injection of Etan at a dosage of 5 mg kg−1 every four days for four times indicated in (a). The tumor vessels were labeled with FITC-conjugated CD31 antibody (green) and nuclei were stained by DAPI (blue). The tumor margin was marked by a white dotted line. Images are representative of three biologically independent mice. Scale bars: 200 μm. c CD8+ T cells number in the interior or margin areas of tumor tissues of H22 tumor-bearing mice after treatment indicated in (b). Data are presented as mean ± s.d. (n = 9 fields for 3 mice; one-way ANOVA followed by Tukey’s HSD post-hoc test). df The numbers of CD8+ T cells (d), CD8+CD69+ T cells, e and CD8+IFN-γ+ T cells (f) in tumor tissues of H22 tumor-bearing mice after treatment indicated in (a). Data are presented as mean ± s.d. (n = 6 mice per group; one-way ANOVA followed by Tukey’s HSD post-hoc test). g Tumor volume of H22 tumor-bearing mice after treatment indicated in a. Data are presented as mean  ± s.e.m. (n = 6 mice per group; two-way ANOVA followed by Bonferroni’s multiple comparisons post-test). h Tumor weight of H22 tumor-bearing mice after treatment indicated in (a). Data are presented as mean ± s.d. (n = 6 mice per group; one-way ANOVA followed by Tukey’s HSD post-hoc test). Source data are provided as a Source Data file.
Fig. 7
Fig. 7. Enhanced tumor accumulation and penetration of anti-PD-1 antibody by Met@Man-MPs.
a Schematic schedule for tumor accumulation and penetration analysis of anti-PD-1 antibody in H22 tumor-bearing mice. b Relative anti-PD-1 antibody content in different tissues and tumors of H22 tumor-bearing mice after treatment with Cy5-labeled anti-PD-1 antibody (100 µg per mice) and Met@Man-MPs pretreated with or without Bati (0.6 mg mL−1) at the Met dosage of 10 mg kg−1 indicated in (a). Data are presented as mean ± s.d. (n = 4 mice per group; one-way ANOVA followed by Tukey’s HSD post-hoc test). c Colocalization of Cy5-labeled anti-PD-1 antibody (red) with endothelial cells labeled with FITC-conjugated CD31 antibody (green) in tumor sections of H22 tumor-bearing mice after treatment with Cy5-labeled anti-PD-1 antibody (100 µg per mice) and Met@Man-MPs pretreated with or without Bati (0.6 mg mL−1) at the Met dosage of 10 mg kg−1 indicated in (a). The nuclei were stained by DAPI (blue). Images are representative of 3 biologically independent mice. Scale bars: 50 μm. d Ratio of Cy5 in tumor parenchyma to that within blood vessels as indicated in c. Data are presented as mean ± s.d. (n = 15 fields for 3 mice; one-way ANOVA followed by Tukey’s HSD post-hoc test). e Time-lapse imaging of Cy5 extravasation and penetration into tumor tissues of H22 tumor-bearing mice after the mice were intravenously injected with Met@Man-MPs pretreated with or without Bati (0.6 mg mL−1) at the Met dosage of 10 mg kg−1 every other day for two times and then intravenously injected with Cy5-labeled anti-PD-1 antibody (100 µg per mice, red). The vasculature was labeled with fluorescein-labeled tomato lectin (green). The arrows indicated the extravascular anti-PD-1 antibody. Images are representative of two biologically independent mice. Scale bars: 10 μm. f Extravascular Cy5 fluorescence normalized by the maximum Cy5 fluorescence within blood vessels at 10 min post-injection (expressed as %Vmax) indicated in e. Data are presented as mean ± s.d. (n = 10 fields for 2 mice; two-way ANOVA followed by Bonferroni’s multiple comparisons post-test). Source data are provided as a Source Data file.
Fig. 8
Fig. 8. Anticancer activity of combination of anti-PD-1 antibody and Met@Man-MPs in H22 tumor-bearing mice.
a Schematic schedule for an anticancer experiment in H22 tumor-bearing mice. bg Individual tumor growth curves of H22 tumor-bearing mice after treatment with PBS (b), Man-MPs (c), Met@Man-MPs (d), anti-PD-1 antibody (e), a combination of Man-MPs and anti-PD-1 antibody (f), or combination of Met@Man-MPs and anti-PD-1 antibody (g) at the anti-PD-1 antibody dosage of 100 µg per mouse and Met dosage of 10 mg kg−1 indicated in (a). h Average tumor growth curves of H22 tumor-bearing mice indicated in a. Data are presented as mean ± s.e.m. (n = 10 mice per group; two-way ANOVA followed by Bonferroni’s multiple comparisons post-test). i Kaplan–Meier survival plot of H22 tumor-bearing mice after treatment indicated in (a) (n = 10 mice per group). j The numbers of CD8+ effector memory T cells (CD3+CD8+CD44+CD62LT cells) in spleens of H22 tumor-bearing mice after treatment indicated in a. Data are presented as mean ± s.d. (n = 6 mice per group; one-way ANOVA followed by Tukey’s HSD post-hoc test). k, l Tumor growth curve after rechallenge with H22 cells (3 × 106 cells, k) and 4T1 cells (1 × 106 cells, l) in naïve mice or combination of anti-PD-1 antibody and Met@Man-MPs-treated mice indicated in (a). The ratio of mice with tumorgenesis is indicated in the brackets. Data are presented as mean ± s.e.m. (n = 10 for naive mice, n = 6 for anti-PD-1 antibody- and Met@Man-MPs-treated mice). Source data are provided as a Source Data file.
Fig. 9
Fig. 9. Anticancer activity and improved tumor immune microenvironment of a combination of anti-PD-1 antibody and Met@Man-MPs in AOM/DSS-induced CAC mice.
a Schematic schedule for anticancer experiment in AOM/DSS-induced CAC mice. b Numbers of tumors with size>3 mm and <3 mm in CAC mice after treatment with PBS, Man-MPs, Met@Man-MPs, anti-PD-1 antibody, a combination of Man-MPs and anti-PD-1 antibody, or combination of Met@Man-MPs and anti-PD-1 antibody at the anti-PD-1 antibody dosage of 100 µg per mouse and Met dosage of 10 mg kg−1 indicated in (a). Data are presented as mean ± s.d. (n = 5 mice per group; one-way ANOVA followed by Tukey’s HSD post-hoc test). cj Percentages of M1-like TAMs (c), M2-like TAMs (d), CD8+ T cells (e), CD8+CD69+ T cells (f), CD4+ T cells (g), CD4+CD69+ T cells (h), MDSCs (i) and Tregs (j) in colon tumors of CAC mice after treatment with PBS, Man-MPs, Met@Man-MPs, anti-PD-1 antibody, a combination of Man-MPs and anti-PD-1 antibody, or combination of Met@Man-MPs and anti-PD-1 antibody at the anti-PD-1 antibody dosage of 100 µg per mouse and Met dosage of 10 mg kg−1 indicated in (a). Data are presented as mean ±  s.d. (n = 5 mice per group; one-way ANOVA followed by Tukey’s HSD post-hoc test). Source data are provided as a Source Data file.
Fig. 10
Fig. 10. Apoptosis and improved tumor immune microenvironment induced by combination of anti-PD-1 antibody and Met@Man-MPs in organotypic slices from one liver cancer patient-derived tumor.
a The ratio of apoptotic tumor cells (CD45 cells) after the tumor slices from patient-derived tumor were treated with anti-human PD-1 antibody, Met@Man-MPs derived from THP-1-origniated macrophages or Met@Man-MPs plus anti-human PD-1 antibody at the concentration of anti-PD-1 antibody and Met of 20 and 40 μg mL−1 in the presence of PBMCs for 36 h, respectively. Data are presented as mean ± s.d. (n = 3 biologically independent samples; one-way ANOVA followed by Tukey’s HSD post-hoc test). (bg) Percentages of M1-like TAMs (b), M2-like TAMs (c), CD8+ T (d), CD8+CD69+ T (e), CD8+IFN-γ+ T (f), and CD8+GzmB+ T cells (g) in the tumor slices from patient-derived tumor after treatment with anti-human PD-1 antibody, Met@Man-MPs derived from THP-1-origniated macrophages or Met@Man-MPs plus anti-human PD-1 antibody at the concentration of anti-PD-1 antibody and Met of 20 and 40 μg mL−1 in the presence of PBMCs for 36 h, respectively. Data are presented as mean ± s.d. (n = 3 biologically independent samples; one-way ANOVA followed by Tukey’s HSD post-hoc test). Source data are provided as a Source Data file.

References

    1. Chen L, Han X. Anti-PD-1/PD-L1 therapy of human cancer: past, present, and future. J. Clin. Invest. 2015;125:3384–3391. doi: 10.1172/JCI80011. - DOI - PMC - PubMed
    1. Zou W, Wolchok JD, Chen L. PD-L1 (B7-H1) and PD-1 pathway blockade for cancer therapy: mechanisms, response biomarkers, and combinations. Sci. Transl. Med. 2016;8:328–324. doi: 10.1126/scitranslmed.aad7118. - DOI - PMC - PubMed
    1. Gong J, Chehrazi-Raffle A, Reddi S, Salgia R. Development of PD-1 and PD-L1 inhibitors as a form of cancer immunotherapy: a comprehensive review of registration trials and future considerations. J. Immunother. Cancer. 2018;6:8. doi: 10.1186/s40425-018-0316-z. - DOI - PMC - PubMed
    1. El-Khoueiry AB, et al. Nivolumab in patients with advanced hepatocellular carcinoma (CheckMate 040): an open-label, non-comparative, phase 1/2 dose escalation and expansion trial. Lancet. 2017;389:2492–2502. doi: 10.1016/S0140-6736(17)31046-2. - DOI - PMC - PubMed
    1. Zhang J, Dang F, Ren J, Wei W. Biochemical aspects of PD-L1 regulation in cancer immunotherapy. Trends Biochem. Sci. 2018;43:1014–1032. doi: 10.1016/j.tibs.2018.09.004. - DOI - PMC - PubMed

Publication types

MeSH terms