. 2021 Jan 19;11(1):1795.
doi: 10.1038/s41598-021-81128-4.

Nanoporous gold nanoleaf as tunable metamaterial

Affiliations

Nanoporous gold nanoleaf as tunable metamaterial

Sangeeta Rout et al. Sci Rep. .

Abstract

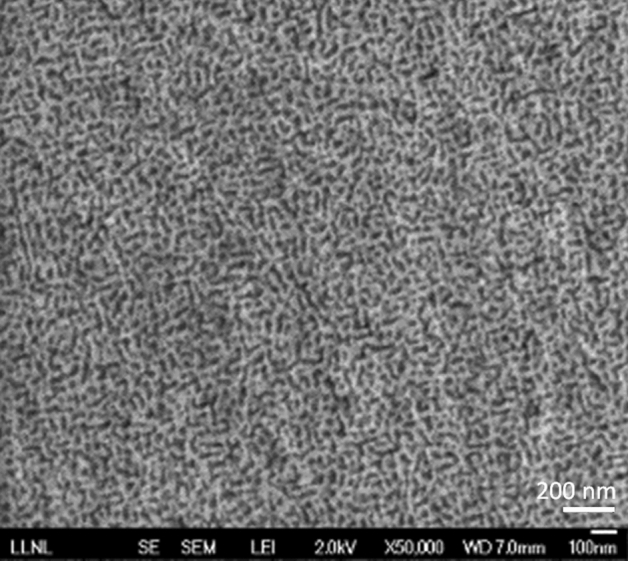
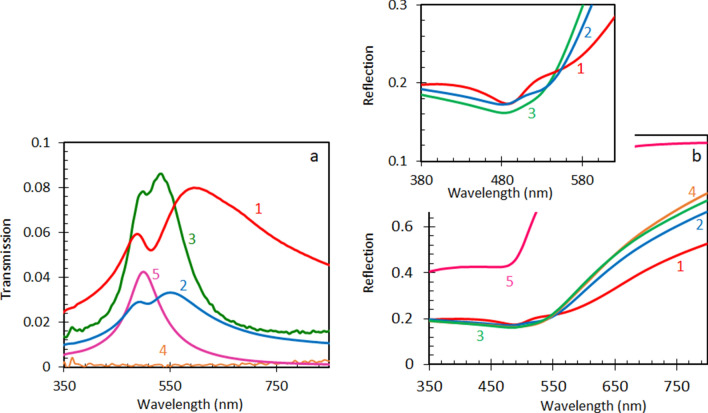
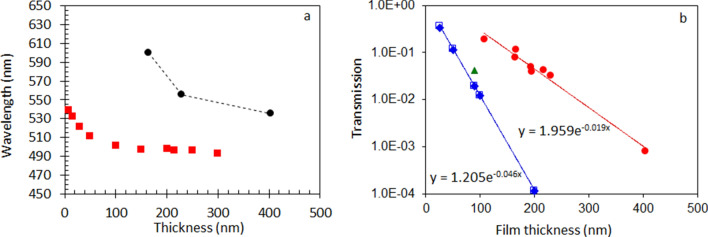
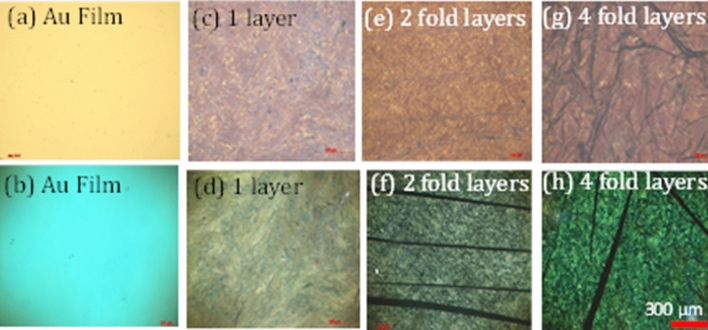
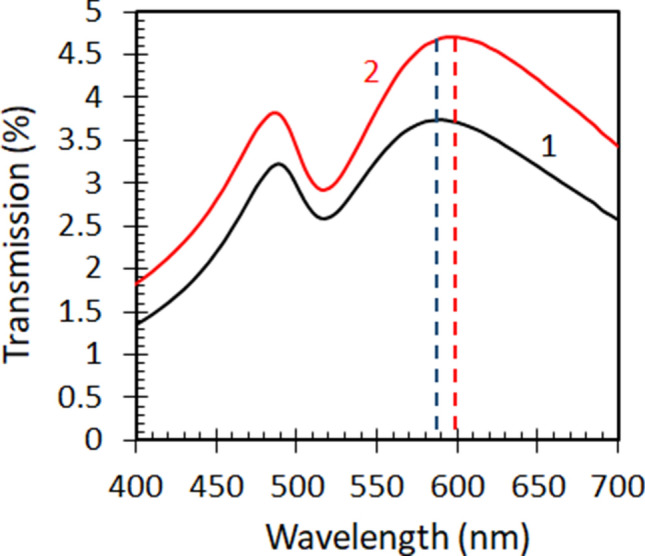
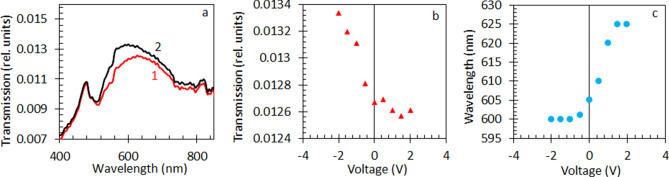
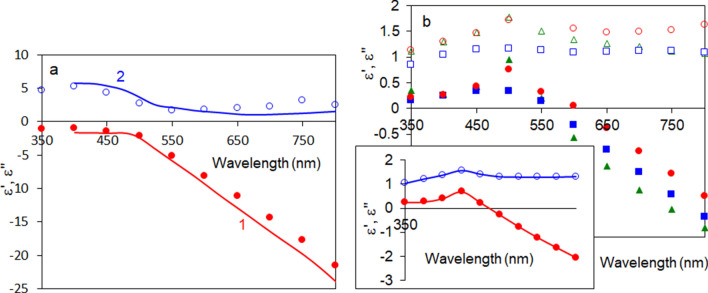
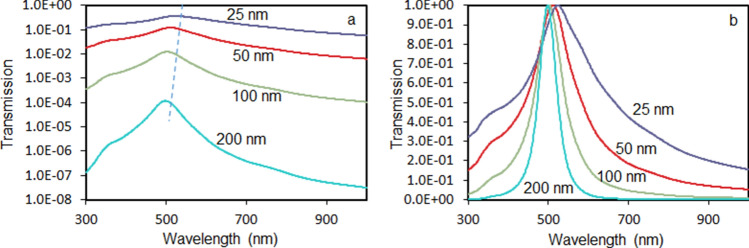
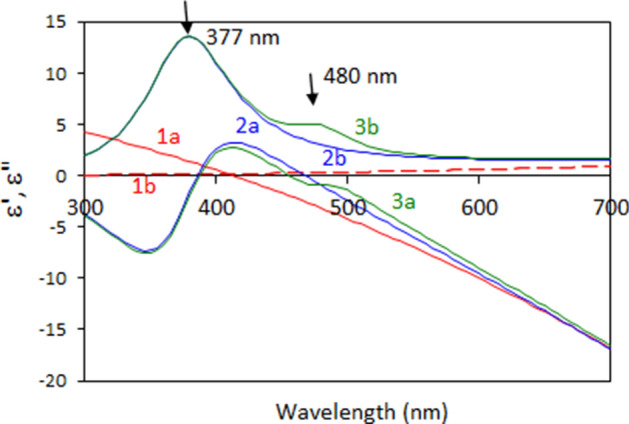
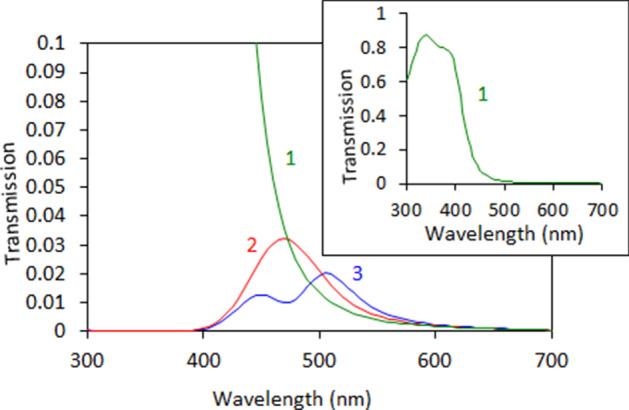
We have studied optical properties of single-layer and multi-fold nanoporous gold leaf (NPGL) metamaterials and observed highly unusual transmission spectra composed of two well-resolved peaks. We explain this phenomenon in terms of a surface plasmon absorption band positioned on the top of a broader transmission band, the latter being characteristic of both homogeneous "solid" and inhomogeneous "diluted" Au films. The transmission spectra of NPGL metamaterials were shown to be controlled by external dielectric environments, e.g. water and applied voltage in an electrochemical cell. This paves the road to numerous functionalities of the studied tunable and active metamaterials, including control of spontaneous emission, energy transfer and many others.


Conflict of interest statement

The authors declare no competing interests.

Figures

Figure 1
Figure 1
Scanning electron microscope (SEM) image of the single layer nanoporous gold leaf sample.
Figure 2
Figure 2
Transmission (a) and reflection (b) spectra of a single-layer (trace 1), two-layers (trace 2), four-layers (multiplied by 100, trace 3) and eight-layers (multiplied by 100, trace 4) NPGLs. Control sample: 90 nm Au film (trace 5). Inset: zoomed part of (b).
Figure 3
Figure 3
(a) Wavelength positions of the maxima of the transmission peaks; red squares—calculation done (using the online solver) for homogeneous Au films; black circles—experimental measurements in porous Au nanoleafs. (b) Red circles: Transmission as the function of the thickness of the NPGL sample, experimentally measured in the maximum at λ ~ 590 nm. Open blue squares: Transmission as the function of the thickness of the homogeneous Au film (characterized by the dielectric permittivities),, calculated at the spectral position of the long-wavelength transmission maximum. Solid blue diamonds: Transmission as the function of the thickness of the homogeneous Au film (characterized by the dielectric permittivities),, calculated at λ = 498 nm. Green triangle: transmission measured in the maximum (at λ = 505 nm) in the homogeneous 90 nm Au film.
Figure 4
Figure 4
Microscopic images of the smooth 90 nm Au film (a,b), single-layer Au nanoleaf (c,d), two-fold Au nanoleaf (e,f), and four-fold Au nanoleaf (g,h) taken in the transmission (b,d,f,h) and reflection (a,c,e,g) modes of the optical microscope.
Figure 5
Figure 5
Transmission spectra of the Au nanoleaf in air (trace 1) and in water (trace 2).
Figure 6
Figure 6
(a) Transmission spectra of Au nanoleaf in a two-electrode electrochemical cell at positive voltage (+ 1.5 V, trace 1) and negative voltage (− 2 V, trace 2) applied to the NPGL working electrode. (b) Transmission peak intensity as a function of the applied voltage. (c) The wavelength of the transmission peak as a function of the applied voltage.
Figure 7
Figure 7
(a) Spectra of the real (red trace 1 and solid circles) and imaginary (blue trace 2 and open circles) parts of the dielectric permittivity of Au. Solid line—the data from Refs.,, characters—the data derived from the experiment. (b) Spectra of real (closed characters) and imaginary (open characters) parts of dielectric permittivity of a single-layer Au nanoleaf (164 nm, red circles), two-fold Au nanoleaf (230 nm, blue squares) and four-fold Au nanoleaf (404 nm, green triangles). Inset: average of the three spectra of dielectric permittivities depicted in the main frame; red closed circles—real parts of dielectric permittivity ε′, blue open circles—imaginary parts of dielectric permittivity ε″.
Figure 8
Figure 8
Normal-incidence transmission spectra of Au films of different thickness, computed using the online solver, for the dielectric permittivities of gold reported in Refs.,, (a) semi-logarithmic vertical scale, dashed line indicates the shift of the transmission maxima; (b)—linear vertical scale, emission maxima are normalized to unity.
Figure 9
Figure 9
Spectra of dielectric permittivities used in the toy model; 1a and 1b—Drude terms (Eq. 1); 2a and 2b Drude and single Lorenzian; 3a and 3b—Drude and two Lorentzians. 1a, 2a, and 3a—real parts of dielectric permittivities; 1b, 2b, and 3b—imaginary parts of dielectric permittivities.
Figure 10
Figure 10
Transmission spectra calculated using the dielectric permittivities determined by the Drude model (trace 1), Drude + single Lorenzian model (trace 2), and Drude + two Lorenzians model (trace 3).

References

    1. Engheta N, Ziolkowski RW. Metamaterials: Physics and Engineering Explorations. New York: Wiley; 2006.
    1. Noginov MA, Podolskiy VA. Tutorials in Metamaterials. Boca Raton: CRC Press; 2011.
    1. Cai W, Shalaev VM. Optical Metamaterials. New York: Springer; 2010.
    1. Maier SA. Plasmonics: Fundamentals & Applications. New York: Springer; 2007.
    1. Raether H. Springer Tracts in Modern Physics. New York: Springer; 1988. pp. 1–133.

LinkOut - more resources