. 2021 Jan 19;4(1):7.
doi: 10.1038/s42003-020-01530-y.

The antimicrobial potential of cannabidiol

Affiliations

The antimicrobial potential of cannabidiol

Mark A T Blaskovich et al. Commun Biol. .

Abstract

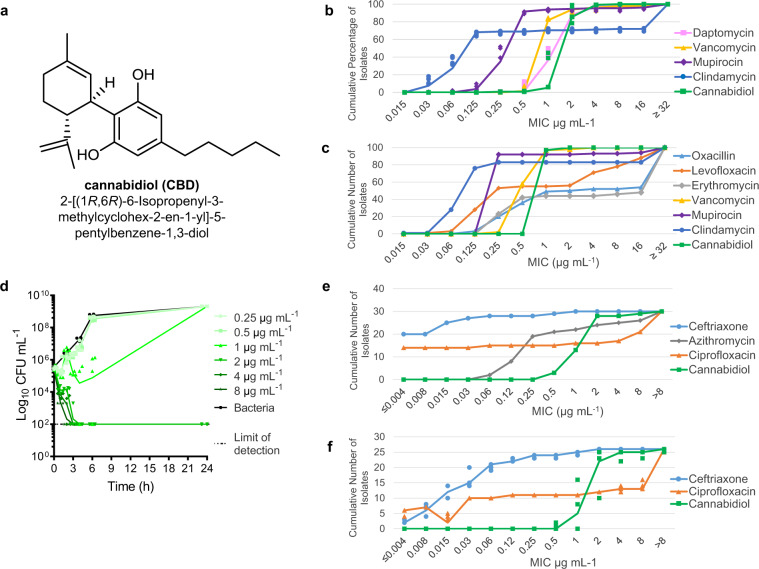
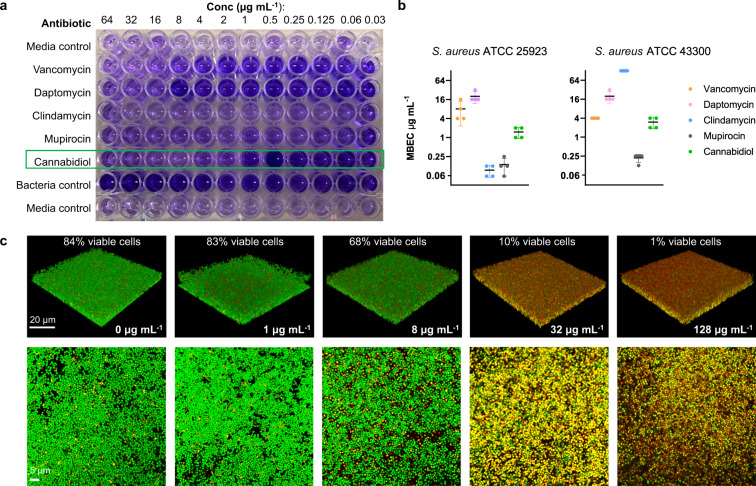
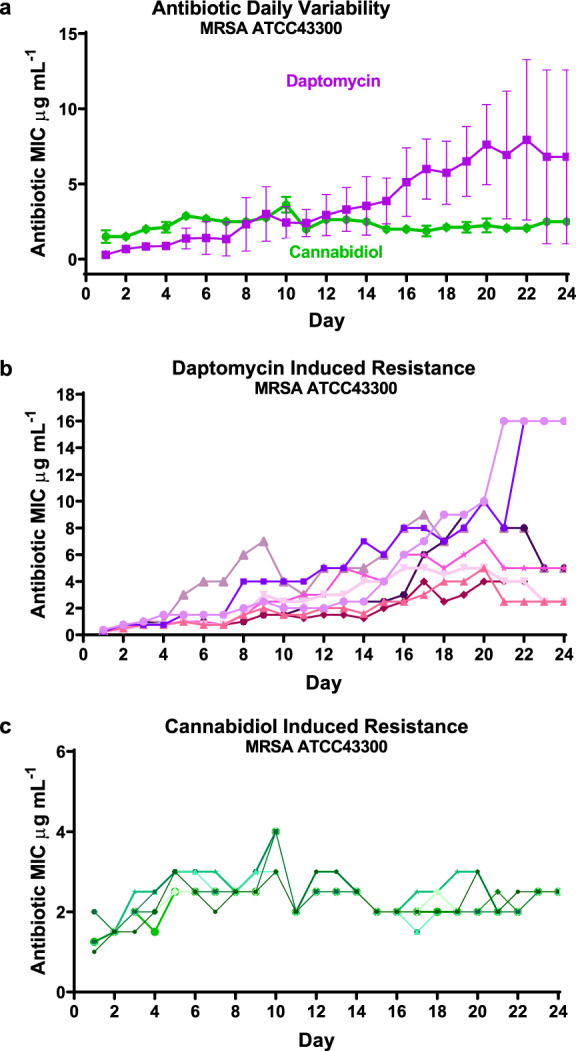
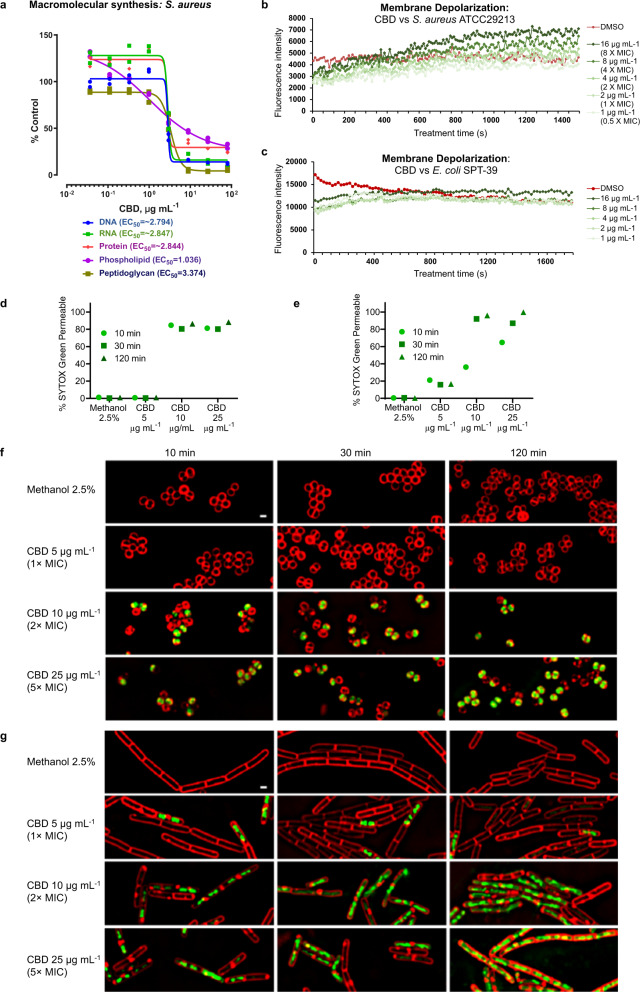
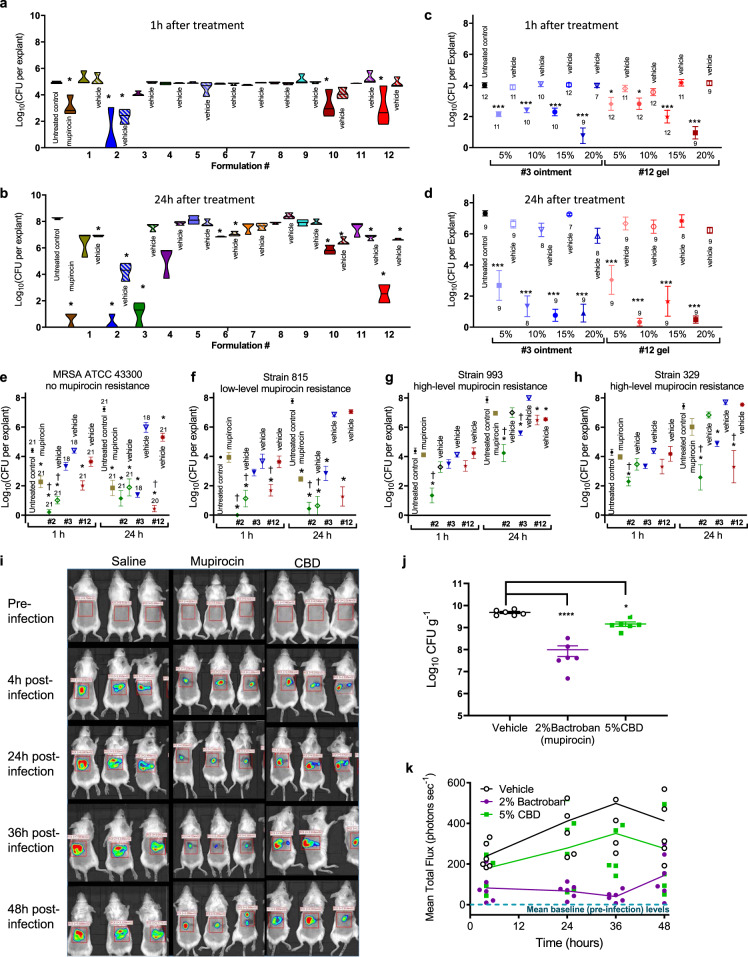
Antimicrobial resistance threatens the viability of modern medicine, which is largely dependent on the successful prevention and treatment of bacterial infections. Unfortunately, there are few new therapeutics in the clinical pipeline, particularly for Gram-negative bacteria. We now present a detailed evaluation of the antimicrobial activity of cannabidiol, the main non-psychoactive component of cannabis. We confirm previous reports of Gram-positive activity and expand the breadth of pathogens tested, including highly resistant Staphylococcus aureus, Streptococcus pneumoniae, and Clostridioides difficile. Our results demonstrate that cannabidiol has excellent activity against biofilms, little propensity to induce resistance, and topical in vivo efficacy. Multiple mode-of-action studies point to membrane disruption as cannabidiol's primary mechanism. More importantly, we now report for the first time that cannabidiol can selectively kill a subset of Gram-negative bacteria that includes the 'urgent threat' pathogen Neisseria gonorrhoeae. Structure-activity relationship studies demonstrate the potential to advance cannabidiol analogs as a much-needed new class of antibiotics.


Conflict of interest statement

The authors declare the following competing interests: M.C. and M.T. are employees of Botanix Inc, who co-funded most of this research. M.A.T.B. consults for Botanix Inc., and is an inventor on several antibiotic patents (unrelated to this work) which are undergoing commercialization. D.Q. and M.D.S. are employees and J.P. founded Linneas (conducted the bacterial cytological profiling). J.P. has an equity interest in Linnaeus Bioscience Incorporated and receives consulting income from the company. The terms of this arrangement have been reviewed and approved by the University of California, San Diego in accordance with its conflict of interest policies. N.B. is founder of BDG Synthesis (conducted the analog synthesis), and D.W.C. is an employee and M.L.P. founded Extherid Biosciences (conducted the ex-vivo pig skin studies), which is now part of Perfectus Biomed Group. The remaining authors declare no competing interests.

Figures

Fig. 1
Fig. 1. Antibacterial activity of cannabidiol.
a Structure of CBD. b MIC90 distribution of CBD against 132 Australian S. aureus isolates. Cumulative percentage of isolates below or equal to a given MIC are indicated. Data are n = 4 biologically independent samples for MIC of each isolate. c MIC90 distribution of CBD against 100 USA S. aureus isolates. Cumulative number of isolates below or equal to a given MIC are indicated. Data are n = 1 for MIC of each isolate. d Time-kill assay of CBD against MRSA ATCC 43300. Data are mean ± SD for n = 4 biologically independent samples. e Broth microdilution MIC distribution of CBD against 30 N. gonorrhoeae isolates. Cumulative number of isolates below or equal to a given MIC are indicated. Data are n = 1. f Agar microdilution MIC distribution of CBD against 26 N. gonorrhoeae isolates. Cumulative number of isolates below or equal to a given MIC are indicated. Data are n = 3 independent experiments.
Fig. 2
Fig. 2. Anti-biofilm activity of cannabidiol.
Minimum biofilm eradication concentration (MBEC) assessment of CBD using crystal violet staining (a) to assess (b) MSSA ATCC 25923 and MRSA ATCC 43300 biofilm remaining after 24 h incubation with CBD, vancomycin, daptomycin, trimethoprim, mupirocin, or clindamycin (biofilm initially established by 48 h growth in TSB + 5% glucose). Data are n = 4 biologically independent samples. c Confocal microscopy of MRSA ATCC 43300 biofilm grown on microscope slides, then treated with CBD at varying concentrations for 24 h. Slides were then stained with SYTO 9 (green, indicates live + dead cells) and propidium iodide (red, indicates dead cells) nucleic acid stains (white scale bars represent 20 µm in the 3D panels and 5 µm in the 2D panels).
Fig. 3
Fig. 3. Broth dilution serial passage resistance induction studies.
a Average daily MIC during exposure of MRSA (ATCC 43300) to sublethal concentrations of daptomycin or CBD over 20 days of bacterial growth, followed by 5 days without antibiotic exposure. Data are mean ± SEM for n = 8 biologically independent samples. b, c The corresponding individual replicates for the two compounds (drug-free from Day 21).
Fig. 4
Fig. 4. Mode of action of cannabidiol.
a Macromolecular synthesis assay in S. aureus RN42200 showing inhibition of radiolabelled substrate uptake in DNA ([2-14C]-thymidine), RNA ([5,6-3H]-uracil), protein (L-[4,5-3H]-leucine), phospholipid ([2-3H]-glycerol) and peptidoglycan ([14C(U)]-glycine) synthesis pathways after 35 min incubation. Data are mean ± SD for n = 2 biologically independent samples. MIC for CBD is 2–3 μg mL−1. b, c Membrane depolarization assay in S. aureus ATCC 29213 b and E. coli SPT-39 c monitoring uptake of potential-sensitive fluorescent dye 3,3-dipropylthiadicarbocyanine iodide [DiSC3(5)] over time in presence of increasing concentrations of CBD. dg Bacterial cytological profiling (BCP) assay in S. aureus ATCC 29213 d, f or B. subtilis PY79 e, g showing uptake of SYTOX™ Green dye over time in the presence of increased concentrations of CBD. Red FM 4–64 dye is used to visualize membranes (white scale bar is 1 µm). The plots d, e quantify the percentage of cells that have been permeabilized, defined as the fraction of cells with a mean SYTOX™ Green intensity greater than a cut-off value of 250 (number of cells measured ranged from 945–8050 for each time/concentration). Since CBD was dissolved in methanol, control cells were treated with 2.5% methanol.
Fig. 5
Fig. 5. Efficacy studies of cannabidiol.
a, b Ex vivo pig skin model. Colony forming units (CFU) remaining on 5 mm biopsy pig skin explants inoculated with 2 ± 0.5 μL of ~5 × 108 CFU mL−1 MRSA ATCC 43300 and incubated at 37 °C in 6-well plates containing a 0.4 μm trans-well insert. Formulations (see Supplementary Table 10) containing CBD or mupirocin (solid colors) and vehicle formulations with no CBD (barred colors) were applied (150 μL) 2 h post-infection. At 1 h (a) or 24 h (b) later tissue was removed and the remaining CFU quantified: n = 3 independent experiments except for formulation 8 at 1 h and formulation 12 at 12 h, n = 2 independent experiments, error bars show SEM; statistical analysis done using GraphPad Prism 8, 2-way ANOVA, Dunnett’s multiple comparisons test, asterisk (*) denotes statistically significant deviation from Growth Control (p < 0.05). c, d Concentration-dependence of ointment #3 and gel #12 formulations containing varying % of CBD (solid symbols) and corresponding vehicle only (open symbols) against MRSA ATCC 43300 in same pig skin model: n = 7–12 biologically independent samples as indicated near each data symbol, error bars show SEM; statistical analysis done using GraphPad Prism 8, one-way ANOVA with Dunnet post-correction, asterisk (*) denotes statistically significant deviation from Growth Control (p < 0.05), **(p < 0.01), ***(p < 0.001)). eh Effectiveness of 2% mupirocin and 20% CBD formulations (liquid #2, ointment #3, and gel #12) (solid symbols) and corresponding vehicle only (open symbols) against mupirocin sensitive and resistant MRSA strains in same pig skin mode: n = 18–21 biologically independent samples for e (indicated near each data symbol), n = 3 for f, n = 6 for g, n = 6 for h, error bars show SEM; statistical analysis done using GraphPad Prism 8, 2-way ANOVA, Dunnett’s multiple comparisons test, asterisk (*) denotes statistically significant deviation from Growth Control, and † indicates significant deviation from mupirocin-treated skin (both p < 0.05)). ik In vivo topical skin infection model. Immunocompromised mice (n = 6 group) were shaved on their back and the skin surface disrupted, then inoculated with 5 × 107 CFU of Xen-29 S. aureus bacteria in a 10 μL droplet. Treatment was initiated immediately after inoculation and repeated at 12, 24, and 32 h after infection, with 50 μL of vehicle, 2% mupirocin, or 5% CBD. Animals were imaged using the Lumina II system (Perkin-Elmer) at 4, 24, 36, and 48 h post-infection (i, only 3 mice shown per image) and bioluminescence (photons per second) determined (j). At 48 h after the first treatment and infection, animals were sacrificed and samples of skin from each animal were homogenized and plated on nutrient agar in order to determine the CFU’s per animal (k). Errors are mean ± SEM, n = 6 animals. Statistical analysis done using GraphPad Prism 8, 1-way ANOVA, Bonferroni post-test.

References

    1. U.S. Department of Health and Human Services, CDC. Antibiotic Resistance Threats in the United States, 2019. Atlanta, GA. (2019).
    1. Roope LSJ, et al. The challenge of antimicrobial resistance: What economics can contribute. Nat. Rev. Drug Discov. 2019;364:eaau4679. - PubMed
    1. Renwick M, Mossialos E. What are the economic barriers of antibiotic R&D and how can we overcome them? Expert Opin. Drug Discov. 2018;13:889–892. doi: 10.1080/17460441.2018.1515908. - DOI - PubMed
    1. Årdal, C. et al DRIVE-AB REPORT. Revitalizing theantibiotic pipeline. Stimulating Innovation While Driving Sustainable Use and Global Access. (2018).
    1. Lepore C, Silver L, Theuretzbacher U, Thomas J, Visi D. The small-molecule antibiotics pipeline: 2014-2018. Nat. Rev. Drug Discov. 2019;18:739. doi: 10.1038/d41573-019-00130-8. - DOI - PubMed

MeSH terms