. 2021 Jan 19;11(1):1758.
doi: 10.1038/s41598-021-81498-9.

Anatomy of the Bezymianny volcano merely before an explosive eruption on 20.12.2017

Affiliations

Anatomy of the Bezymianny volcano merely before an explosive eruption on 20.12.2017

Ivan Koulakov et al. Sci Rep. .

Abstract

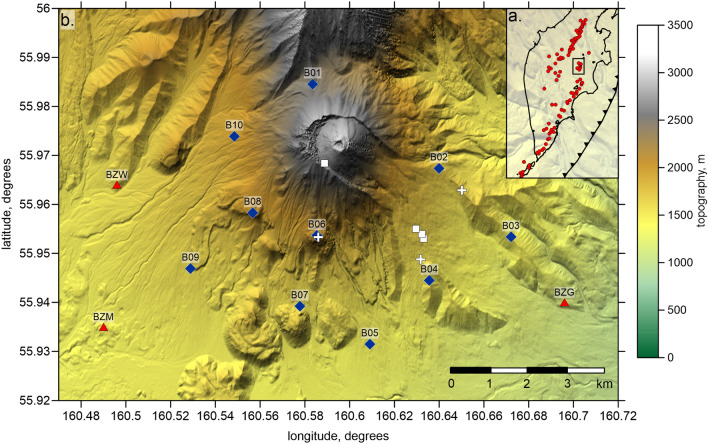
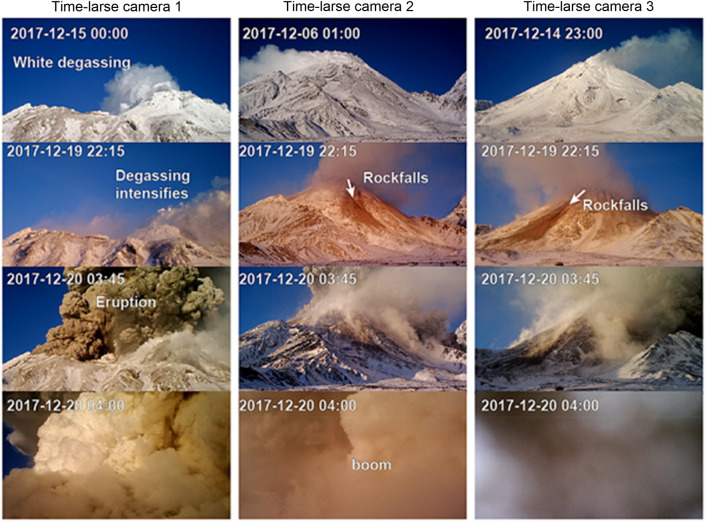
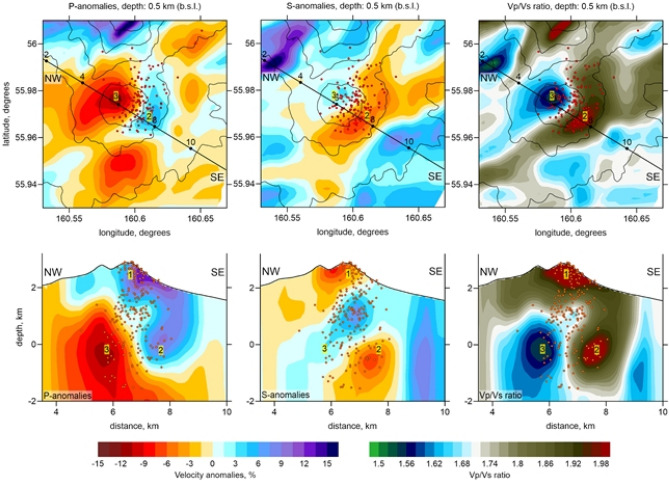
Strong explosive eruptions of volcanoes throw out mixtures of gases and ash from high-pressure underground reservoirs. Investigating these subsurface reservoirs may help to forecast and characterize an eruption. In this study, we compare seismic tomography results with remote sensing and petrology data to identify deep and subaerial manifestations of pre-eruptive processes at Bezymianny volcano in Kamchatka shortly before its violent explosion on December 20, 2017. Based on camera networks we identify precursory rockfalls, and based on satellite radar data we find pre-eruptive summit inflation. Our seismic network recorded the P and S wave data from over 500 local earthquakes used to invert for a 3D seismic velocity distribution beneath Bezymianny illuminating its eruptive state days before the eruption. The derived tomography model, in conjunction with the presence of the high-temperature-stable SiO2 polymorph Tridymite in juvenile rock samples , allowed us to infer the coexistence of magma and gas reservoirs revealed as anomalies of low (1.5) and high (2.0) Vp/Vs ratios, respectively, located at depths of 2-3 km and only 2 km apart. The reservoirs both control the current eruptive activity: while the magma reservoir is responsible for episodic dome growth and lava flow emplacements, the spatially separated gas reservoir may control short but powerful explosive eruptions of Bezymianny.


Conflict of interest statement

The authors declare no competing interests.

Figures

Figure 1
Figure 1
Study area. (a) Location of the study region (black rectangle) in the Kamchatka map. Red dots are the Holocene volcanoes. (b) Topography map in the area of the Bezymianny volcano (https://tandemx-science.dlr.de/). Red triangles depict permanent stations of the KBGS; blue diamonds are the temporary stations installed in 2017–2018, white squares are the rock sampling sites, and white crosses mark the locations of the time-lapse cameras. The image has been produced using the Surfer Golden Software 13 (https://www.goldensoftware.com/products/surfer).
Figure 2
Figure 2
Images taken by three time-lapse cameras reveal visual signatures of the eruption preparation, such as rock falls and strong degassing 6 or more hours prior to the eruption. The lower row corresponds to the eruption moment. Date and time in UTC. Locations of the cameras are indicated by white crosses in Fig. 1.
Figure 3
Figure 3
Distributions of the local seismicity at the proximity of Bezymianny recorded by the temporary network. (ac) Locations of events in a vertical section (same as used for presenting the main results in Fig. 4) colored according to the time before the eruption. Note that during the week before the eruption, mostly shallow events were recorded. (d) Distribution of the focal depths versus the time prior to the eruption. Ellipses mark distinct seismicity clusters discussed in the text. The image has been produced using the Surfer Golden Software 13 (https://www.goldensoftware.com/products/surfer).
Figure 4
Figure 4
Results of tomographic inversions for the Vp and Vs anomalies and the Vp/Vs ratio in a depth level (upper row) and a vertical section (lower row). The location of the profiles is shown in the maps. Red dots indicate the locations of events at the distance of less than 0.5 km from the sections. Contour lines in the maps indicate the topography at every 500 m (http://www.marine-geo.org). Yellow numbers indicate inferred volcano surface anomaly (1), magma reservoirs (2) and gas reservoir (3). The image has been produced using the Surfer Golden Software 13 (https://www.goldensoftware.com/products/surfer).
Figure 5
Figure 5
TerraSAR-X amplitude imagery of Bezymianny. (a) Surface reflectivity of the radar signal on 07 December 2017. Arrows refer to the azimuth and Line-of-Sight (LOS) direction of the sattelite. Inset indicates the area zoomed in for (ad). (b) Reflectivity on 18 December 2017. Dark shadow regions due to opening tensile fractures (20 m wide, N–S extent, approx. 100 m) that appeared two days before the 20 December 2017 eruption. (c) Amplitude changes shown with red and green colored pixels. Please note the concentric pattern (white dashed lines) of newly emerged radar shadows. (d) Pixel offsets indicate the motion of displacement related to the opening of the shadow casting fractures and summit uplift towards LOS. Images a-c generated using GAMMA Remote Sensing software as well as Matplotlib, OpenCV libraries in Python. Image d: displacements generated with the Matlab based Particle Image Velocimetry (PIV) software PIVlab, plotted with Python. TerraSAR-X (TSX) spotlight-mode satellite images available from German Aerospace Center (DLR).
Figure 6
Figure 6
Rock sampling and petrological analysis. (a) Time-lapse pictures of Bezymianny during the eruption and shortly after the eruption with the indication of the rock sampling sites. (b) Picture of the pyroclastic flow of the recent eruption. (c, d) BSE image of two types of juvenile material: (c) JM1, a porous basaltic andesite with glassy groundmass. Pl—plagioclase, Px—pyroxene, Gl—glass, Tr—Tridymite, V—vapor bubbles. (d). JM2 porous andesite with Tridymite and glass in groundmass.
Figure 7
Figure 7
Schematic sketch of the plumbing system prior to the eruption. Background is the distribution of the Vp/Vs ratios along the vertical section in Fig. 4. The areas of low resolution are masked. Dotted line depicts the region of possible storage and migration of gases. Locations of the possible origins of samples JM1 and JM2 are indicated with arrows. The location of the mid-crustal magma reservoir is based on the previous larger-scale tomography study.

References

    1. Pyle, D.M. Sizes of volcanic eruptions in The Encyclopedia of Volcanoes (eds. Sigurdsson, H., Houghton, B., McNutt, S., Rymer, H. & Stix, J.) 257–264 (Academic Press, 2015).
    1. Marzocchi W, Bebbington MS. Probabilistic eruption forecasting at short and long time scales. Bull. Volcanol. 2012;74(8):1777–1805. doi: 10.1007/s00445-012-0633-x. - DOI
    1. Jousset P, et al. The 2010 explosive eruption of Java's Merapi volcano—a ‘100-year’event. J. Volcanol. Geotherm. Res. 2012;241:121–135.
    1. Voight B, et al. Remarkable cyclic ground deformation monitored in real-time on Montserrat, and its use in eruption forecasting. Geophys. Res. Lett. 1998;25(18):3405–3408. doi: 10.1029/98GL01160. - DOI
    1. Sparks RSJ. Forecasting volcanic eruptions. Earth Planet. Sci. Lett. 2003;210(1–2):1–15. doi: 10.1016/S0012-821X(03)00124-9. - DOI