. 2021 Jan 5:14:598406.
doi: 10.3389/fnins.2020.598406. eCollection 2020.

Acute and Long-Term Circuit-Level Effects in the Auditory Cortex After Sound Trauma

Affiliations

Acute and Long-Term Circuit-Level Effects in the Auditory Cortex After Sound Trauma

Marcus Jeschke et al. Front Neurosci. .

Abstract

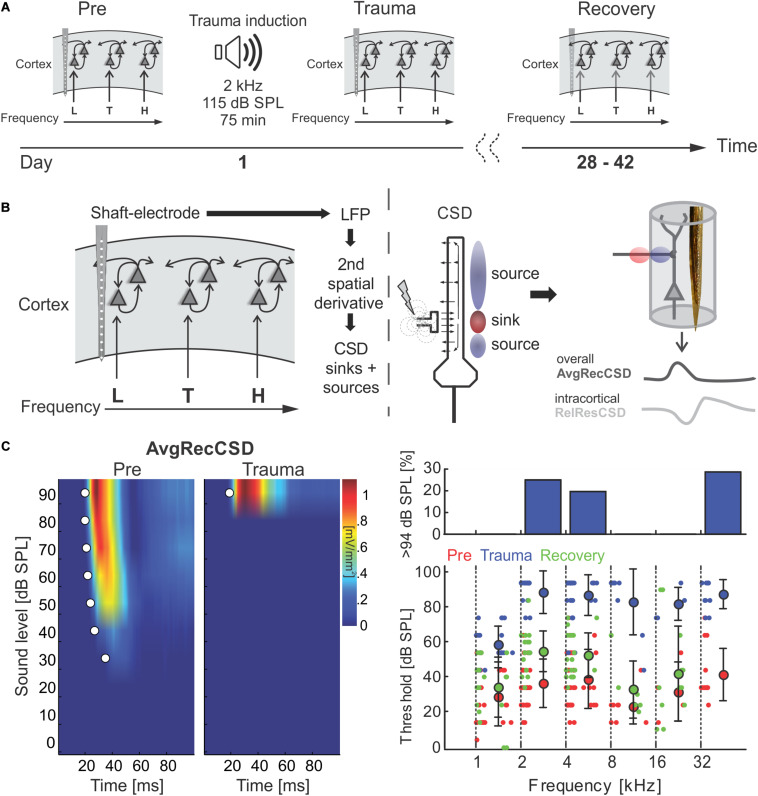
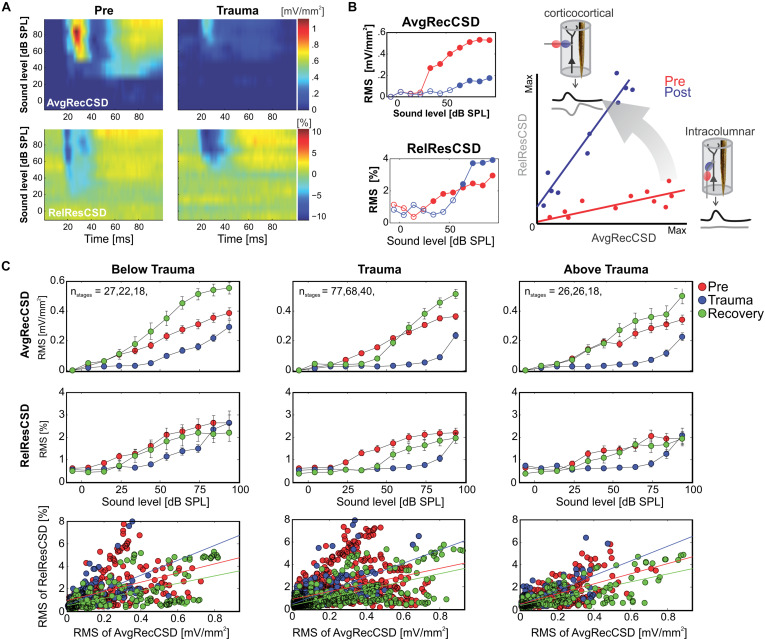
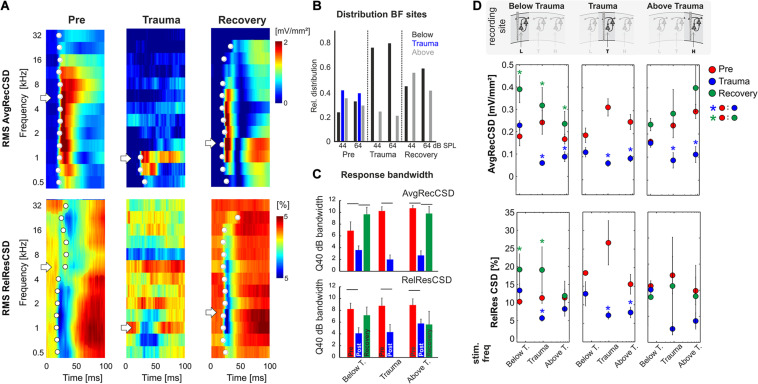
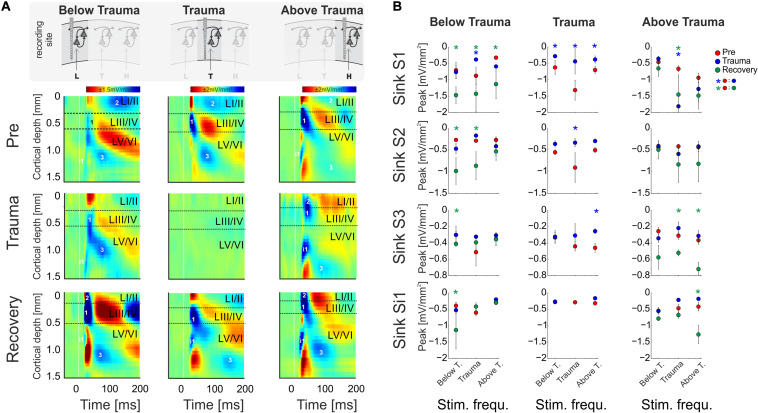
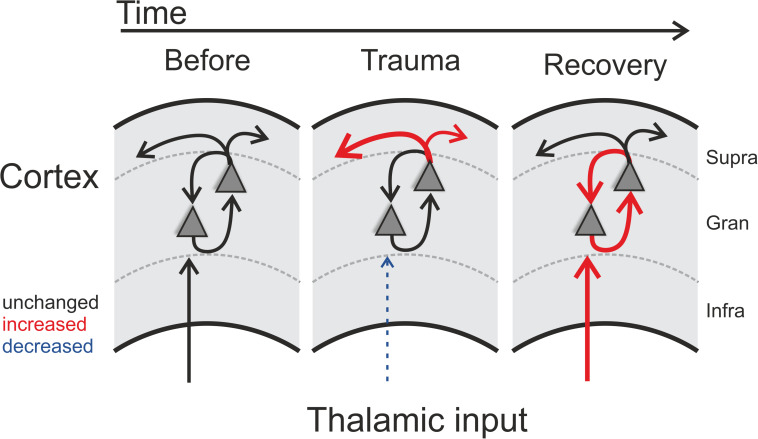
Harmful environmental sounds are a prevailing source of chronic hearing impairments, including noise induced hearing loss, hyperacusis, or tinnitus. How these symptoms are related to pathophysiological damage to the sensory receptor epithelia and its effects along the auditory pathway, have been documented in numerous studies. An open question concerns the temporal evolution of maladaptive changes after damage and their manifestation in the balance of thalamocortical and corticocortical input to the auditory cortex (ACx). To address these issues, we investigated the loci of plastic reorganizations across the tonotopic axis of the auditory cortex of male Mongolian gerbils (Meriones unguiculatus) acutely after a sound trauma and after several weeks. We used a residual current-source density analysis to dissociate adaptations of intracolumnar input and horizontally relayed corticocortical input to synaptic populations across cortical layers in ACx. A pure tone-based sound trauma caused acute changes of subcortical inputs and corticocortical inputs at all tonotopic regions, particularly showing a broad reduction of tone-evoked inputs at tonotopic regions around the trauma frequency. At other cortical sites, the overall columnar activity acutely decreased, while relative contributions of lateral corticocortical inputs increased. After 4-6 weeks, cortical activity in response to the altered sensory inputs showed a general increase of local thalamocortical input reaching levels higher than before the trauma. Hence, our results suggest a detailed mechanism for overcompensation of altered frequency input in the auditory cortex that relies on a changing balance of thalamocortical and intracortical input and along the frequency gradient of the cortical tonotopic map.

Keywords: auditory cortex; circuit level analysis; corticocortical; noise-induced hearing loss; thalamocortical.


Conflict of interest statement

The authors declare that the research was conducted in the absence of any commercial or financial relationships that could be construed as a potential conflict of interest.

Figures

FIGURE 1
FIGURE 1
(A) Schematic representation of the timeline of experiments investigating sound trauma related effects in the auditory cortex. Electrophysiological recordings were obtained directly before (Pre) and after trauma (Trauma) as well as after 4 to 6 weeks (Recovery). The schematics symbolize a piece of auditory cortex with an inserted shaft electrode and tonotopic locations corresponding to the trauma frequency (T) as well as lower (L) and higher frequencies (H). (B) Schematic of data analysis strategy (see main text for further explanation). (C) Analysis of significant AvgRecCSD responses to investigate sound trauma related effects on cortical response thresholds. A representative example (left panel) depicts the AvgRecCSD (heat map coded; warm colors correspond to larger AvgRecCSD values; significant responses are indicated by white circles) in response to presentations of 2 kHz tones and illustrates the increase in threshold from 34 dB SPL to 94 dB SPL following trauma induction. Thresholds determined in the population data were plotted for different frequency bins and time points relative to trauma (right bottom panel). Immediately after trauma induction (blue circles) a threshold could not be determined in a number of cases (right top panel). Four to 6 weeks after trauma thresholds (green circles) recovered to a large degree.
FIGURE 2
FIGURE 2
(A) Representative example of AvgRecCSD (top panels) and RelResCSD (bottom panels) evoked by 1 kHz stimulation prior to (left) and after trauma induction (right) at a cortical site with a BF of 5.6 kHz. (B) For further quantitative analysis root-mean-square values during 100 ms stimulus presentation were calculated for AvgRecCSD and RelResCSD. Prior to trauma induction (red circles) the threshold of activation was 34 dB SPL (filled circles) and increased to 64 dB SPL after trauma. Small columnar insets schematize the effects of the geometrical arrangement of projection systems into a cortical column on the AvgRecCSD, a measure of the overall activity in a cortical column, and the RelResCSD, a measure of the unbalanced activity by sinks and sources, distributed across the cylinder of integration reconstructed around the recording site. While AvgRecCSD values generally decreased after trauma, RelResCSD values even increased from around 2 to 4%. Note, that both before and after trauma induction AvgRecCSD and RelResCSD were highly correlated (p < 2 × 10− 5). In the schematic depiction of the comparison between both parameters (right), red and blue lines indicate linear regression lines before and after trauma, respectively. Comparisons of their slopes and offsets allow us to investigate the effect of sound-trauma on local and corticocortical synaptic circuits. (C) Across all experiments and independent of the frequency of pure tone stimulation relative to the trauma frequency AvgRecCSD (top panels) values increased with increasing sound levels (data are shown as mean ± SEM). As for the individual example in panels (A,B), RelResCSD (middle panels) values also increased with increasing level. Expectedly, after trauma a reduction of AvgRecCSD values was observed. Interestingly, several weeks after trauma (green circles – Recovery), higher mean AvgRecCSD values than before trauma were observed. These changes seem not to be counterbalanced by relative increases in RelResCSD values. A regression analysis on the relationship between AvgRecCSD and RelResCSD revealed significant correlations in all cases analyzed (p < 10− 13). For further quantitative analysis see main text.
FIGURE 3
FIGURE 3
(A) Representative example of AvgRecCSD (top) and RelResCSD (bottom) obtained after stimulation with varying sound frequencies at moderate sound level (64 dB SPL) prior to (left), after trauma induction (middle) and after 4 weeks of recovery (right). The respective BFs defined by the maximum AvgRecCSD peak amplitude are indicated by white arrows. Before trauma, the BF in the example was found to be 5.6 kHz. At the corresponding recording position, the BF after 4 weeks of recovery was decreased to 1.4 kHz. Onset latency of significant activation (2SD > baseline) at each sound frequency is indicated by white circle. (B) Distributions of the BF (based on granular sink S1 peak amplitude) determined at 44 as well as 64 dB SPL and measured at recording sites with BFs below, around and above the trauma frequency (bar colors) at the three time points directly before and after trauma induction as well as after 4 weeks of recovery. For Chi-Square-test results, see main text. (C) Response bandwidths before (Pre) and after (Trauma) the trauma and 4 weeks later (Recovery) measured by Q40dB values (in octaves) were calculated for the RMS values of the AvgRecCSD (top) and the RelResCSD (bottom). (D) Quantitative comparison of RMS values of AvgRecCSD (top) and RelResCSD (bottom) obtained after stimulation at moderate sound level (64 dB SPL) with sound frequencies below, at and above the trauma. Data prior to (red), after trauma induction (blue) and after 4–7 weeks of recovery (green) are plotted. For statistical results based on an rmANOVA and further explanation see main text and Tables 3.1–3.5. Blue and green asterisks mark significant differences between groups identified by post hoc paired-sample Student’s t-test based on a Bonferroni-corrected level of significance due to 9 post hoc tests for each subpanel of α* = α/9 = 0.00556. Comparisons without asterisk are hence not significantly different (n.s.).
FIGURE 4
FIGURE 4
(A) CSD profiles obtained at a moderate sound level (64 dB SPL) before (Pre) and after trauma induction (Trauma) as well as after 4–6 weeks of recovery (Recovery) for all three categories of recording sites, viz. with BF representations below, around and above the trauma frequency (left to right). Effects of sound trauma induction on respective sink components S1, S2, S3, and iS1 are shown for stimulation with the BF from pre-measurement. (B) Quantification of sink peak amplitudes prior to (red), after trauma induction (blue) and after 4 weeks of recovery (green) at the different recording sites and after stimulation with varying sound frequencies (Low, Middle, High). For statistical results based on an rmANOVA and further explanation the reader is referred to the main text and Tables 3.6–3.8. Blue and green asterisks mark significant differences between groups identified by post hoc paired-sample Student’s t-test based on a Bonferroni-corrected level of significance due to 9 post hoc tests for each sink of α* = α/9 = 0.00556. Comparisons without asterisk are hence not significantly different (n.s.).
FIGURE 5
FIGURE 5
Schematic illustration of trauma-induced changes over time. Note that each panel represents one cortical recording patch with lateral corticocortical connections represented by the uppermost arrows (supragranular layer boundary, gray dashed lines), local intracolumnar connections in the granular layer boundaries, and corresponding thalamocortical inputs that arise via the infragranular layer boundaries. Acoustic trauma led to increased auditory thresholds, which we found to be present over the entire tonotopic gradient (cf. Figure 1C). On a columnar level, as indicated by the scheme, this can be explained by noise-trauma induced decreased strength of local thalamic input to ACx (indicated by dashed thin blue arrow in middle panel; cf. Figures 3A,D). While overall columnar activity was consistently decreased across the tonotopic gradient, the relative contribution of corticocortical activity was increased immediately after the trauma (upper red arrows in middle panel; cf. Figure 2). After recovery over weeks, these acute effects were reversed: while increased sensory input from thalamus was now coupled with an increased local intracolumnar gain of tone-evoked cortical activity (red arrows in right panel; cf. Figure 4), the recruitment of lateral corticocortical circuits was relatively decreased to pre-trauma condition levels or even below (for frequency regions above trauma, blue dashed arrow in right panel) (cf. Figure 2).

Similar articles

Cited by

References

    1. Ahlf S., Tziridis K., Korn S., Strohmeyer I., Schulze H. (2012). Predisposition for and prevention of subjective tinnitus development. PLoS ONE 7:e44519. 10.1371/journal.pone.0044519 - DOI - PMC - PubMed
    1. Asokan M. M., Williamson R. S., Hancock K. E., Polley D. B. (2018). Sensory overamplification in layer 5 auditory corticofugal projection neurons following cochlear nerve synaptic damage. Nat. Commun. 9:2468. 10.1038/s41467-018-04852-y - DOI - PMC - PubMed
    1. Bieszczad K. M., Weinberger N. M. (2010). Remodeling the cortex in memory: Increased use of a learning strategy increases the representational area of relevant acoustic cues. Neurobiol. Learn. Mem. 94 127–144. 10.1016/j.nlm.2010.04.009 - DOI - PMC - PubMed
    1. Brozoski T. J., Bauer C. A., Caspary D. M. (2002). Elevated fusiform cell activity in the dorsal cochlear nucleus of chinchillas with psychophysical evidence of tinnitus. J. Neurosci. 22 2383–2390. 10.1523/JNEUROSCI.22-06-02383.2002 - DOI - PMC - PubMed
    1. Chen G.-D., Sheppard A., Salvi R. (2016). Noise trauma induced plastic changes in brain regions outside the classical auditory pathway. Neuroscience 315 228–245. 10.1016/j.neuroscience.2015.12.005 - DOI - PMC - PubMed

LinkOut - more resources