. 2021 Jan 5:12:573714.
doi: 10.3389/fnsyn.2020.573714. eCollection 2020.

Calcium Sensors STIM1 and STIM2 Regulate Different Calcium Functions in Cultured Hippocampal Neurons

Affiliations

Calcium Sensors STIM1 and STIM2 Regulate Different Calcium Functions in Cultured Hippocampal Neurons

Liliya Kushnireva et al. Front Synaptic Neurosci. .

Abstract

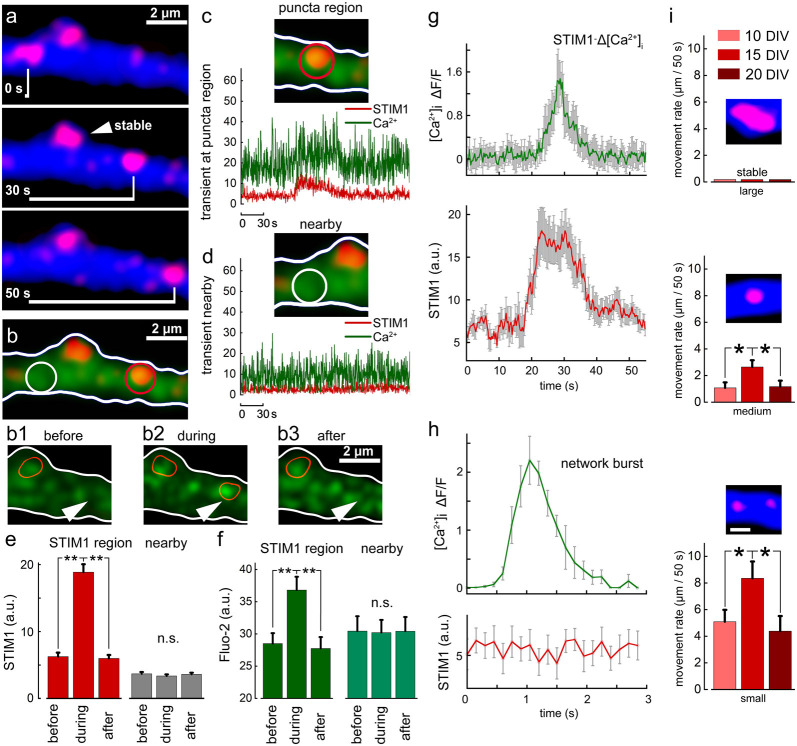
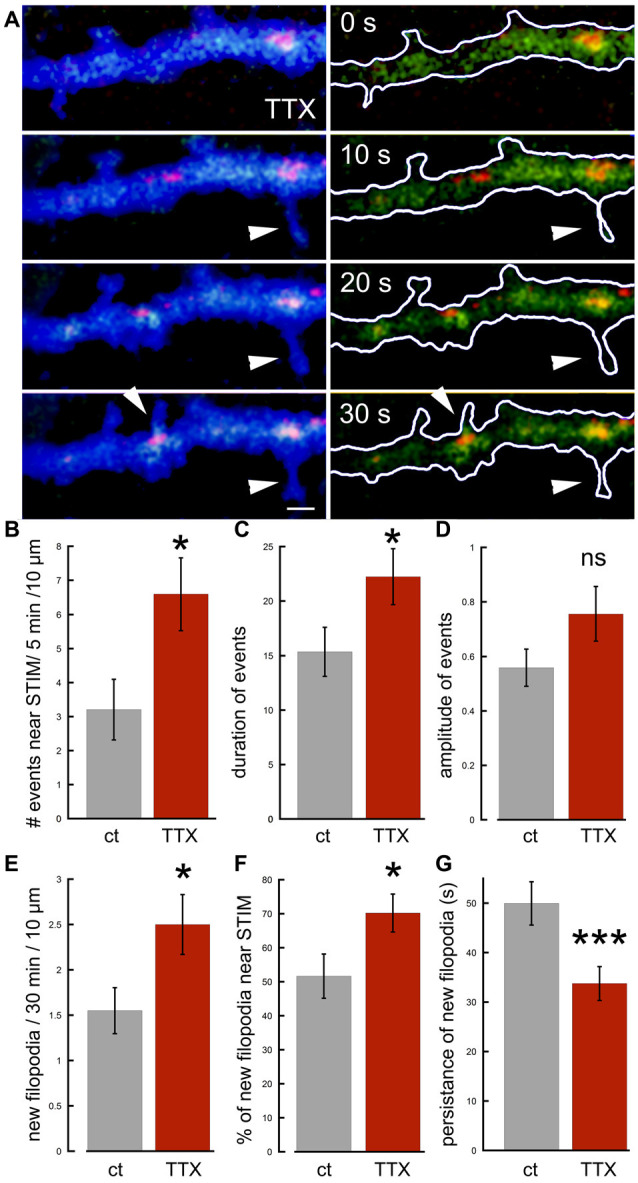
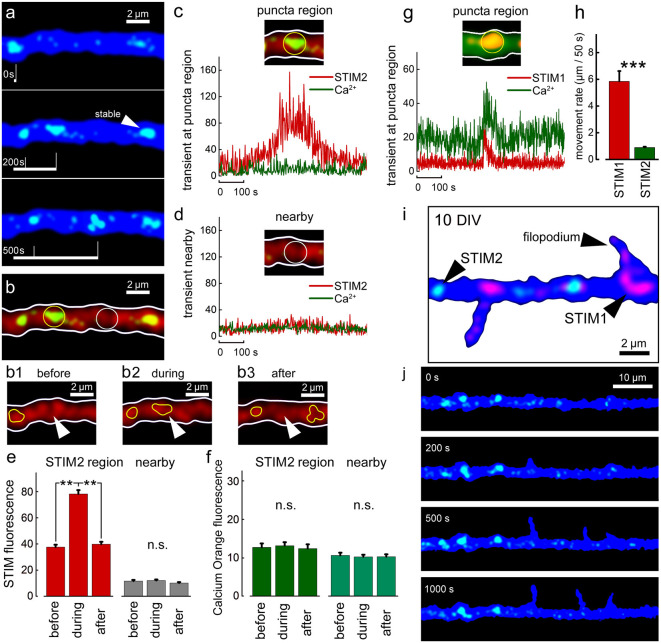
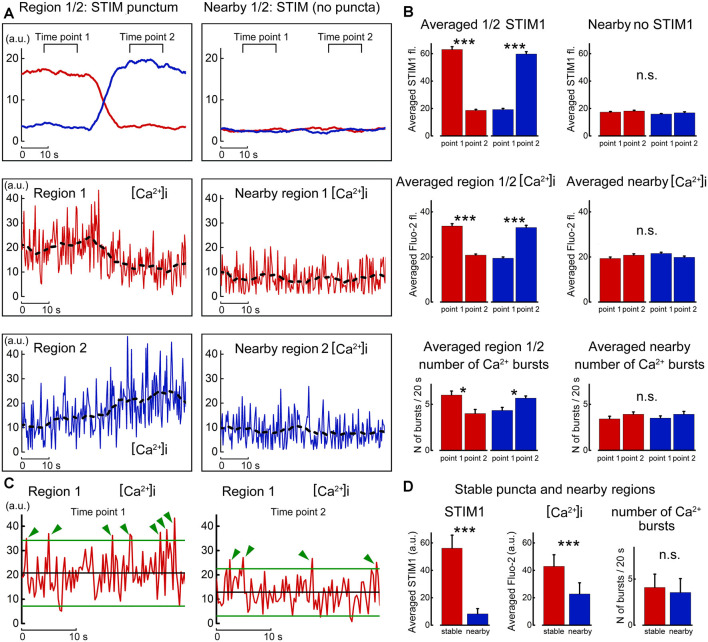
There are growing indications for the involvement of calcium stores in the plastic properties of neurons and particularly in dendritic spines of central neurons. The store-operated calcium entry (SOCE) channels are assumed to be activated by the calcium sensor stromal interaction molecule (STIM)which leads to activation of its associated Orai channel. There are two STIM species, and the differential role of the two in SOCE is not entirely clear. In the present study, we were able to distinguish between transfected STIM1, which is more mobile primarily in young neurons, and STIM2 which is less mobile and more prominent in older neurons in culture. STIM1 mobility is associated with spontaneous calcium sparks, local transient rise in cytosolic [Ca2+]i, and in the formation and elongation of dendritic filopodia/spines. In contrast, STIM2 is associated with older neurons, where it is mobile and moves into dendritic spines primarily when cytosolic [Ca2+]i levels are reduced, apparently to activate resident Orai channels. These results highlight a role for STIM1 in the regulation of [Ca2+]i fluctuations associated with the formation of dendritic spines or filopodia in the developing neuron, whereas STIM2 is associated with the maintenance of calcium entry into stores in the adult neuron.

Keywords: STIM; calcium stores; cytosolic calcium; dendritic spines; filopodia; hippocampal culture; store operated channels.


Conflict of interest statement

The authors declare that the research was conducted in the absence of any commercial or financial relationships that could be construed as a potential conflict of interest.

Figures

Figure 1
Figure 1
Colocalization of transfected stromal interaction molecule 1 (STIM1) or STIM2 with native STIMs identified by immunocytochemistry. Cells were transfected at 7 days in vitro (DIV) and fixed in PFA at 10 DIV. Secondary antibodies were Cy2 anti-rabbit and Cy5 anti-goat. Lasers and channels were distributed as follows: BFP (cell morphology marker) 405 nm (blue), Cy2 (STIM1, anti-rabbit) 458 nm, STIM2 + YFP 514 nm, STIM1 + mCherry 543 nm, Cy5 (STIM2, anti-goat) 633 nm. Overall, in the figure, STIM1 is shown in red and STIM2 in green. 3D-reconstructed Z-stacks, slow, high-resolution imaging mode, separate imaging tracks, and the GASP detector of Zeiss 880 were used for best dye/staining separation. Partial overlap of the transfected species with the immunocytochemically detected species was clear for STIM1 (A,D, respectively) and was different from those of STIM2 (B,E). It should be noted that some transfected STIM1&2 puncta (A) were not detected in the immunostaining for STIM1&2 (D), probably because the antibody detects fewer puncta in the fixed tissue, unlike the transfected species that is imaged in-toto. This can be seen in the merged images (C,F).
Figure 2
Figure 2
Immunohistochemical localization of STIM1&2 in cultured hippocampal neurons with and without extracellular calcium. (A,B) Sample dendrites were taken from 10- to 20-day-old cultures and stained for STIM1(red) and STIM2 (blue) in cells transfected with EGFP (green) to visualize morphology in the presence and absence of extracellular calcium. It is apparent that the 10-day-old culture contains more STIM1 than STIM2 puncta, and the opposite is seen in the 20-day-old neuron. Under the calcium-free condition, STIM2 flows into protrusions in young and, especially, old culture. (C) Bar graphs quantification of the results illustrated on the left. The difference between STIM1 and 2 in 10 DIV in both conditions is highly significant (control conditions: n = 10 dendrites from five cells for each group, ANOVA p < 0.0001; in calcium-free medium: n = 10 dendrites from five cells for each group, ANOVA p < 0.0001). (D) Bar graphs quantification of the results illustrated on the right. The difference between STIM1 and 2 in 20 DIV in both conditions is highly significant (control conditions: n = 10 dendrites from five cells for each group, ANOVA p < 0.0002; in calcium-free medium: n = 10 dendrites from five cells for each group, ANOVA p < 0.0001). *Significant, 0.05 > p > 0.01; **very significant, 0.01 > p > 0.001; ***highly significant, p < 0.001.
Figure 3
Figure 3
Averaged STIM 1&2 fluorescence in protrusion, base, and shaft dendrites, in normal medium (2 mM Ca) and 15 min after incubation with a calcium-free medium. (A) STIM1 (red) and 2 (green) fluorescence in cell incubated with and without calcium, 10 DIV. (B) Bar graphs: averaged fluorescence minus background for in each group, 10 DIV. The difference between STIM1 and 2 in the base in both conditions and the difference between STIM2 with and without calcium in protrusion is highly significant (n = 10 dendrites from six cells for each group, ANOVA p < 0.001). (C) STIM1 (red) and 2 (green) fluorescence in a medium with and without calcium, 20 DIV. (D) Bar graphs: averaged fluorescence minus background for in each group, 20 DIV. The difference between STIM1 and 2 in the base in both conditions is not significant, but the difference between STIM2 with and without calcium in protrusion is highly significant (n = 8 dendrites from four cells for each group, ANOVA p < 0.001). (E) An example of the moving of STIM1/2 puncta in a protrusion (spine) in medium with and without calcium and after the return of calcium back to normal. White arrows mark protrusions in which the influx of STIM2 in a calcium-free medium is most noticeable (A,C, right panels). (F) STIM1 and STIM2 fluorescence at the base with protrusions (filopodia or spines) with background subtracted, at 10 DIV, 15, and 20 DIV. DIV 10: 34 protrusions; DIV 15: 30; DIV 20: 35 protrusions. (G) An example fluorescence calculation of STIM1/2 puncta at the base with protrusions (spine) for (F). *Significant, 0.05 > p > 0.01; ***highly significant, p < 0.001; n.s., not significant, p ≥ 0.05.
Figure 4
Figure 4
New protrusions are associated with STIM1. (A1) Puncta are shown at two time-points; t = 0 and (A2) t = 15 min. Top images are EGFP (green, for morphology) and STIM1-mCherry (red) merged. Bottom panels show the same fields with EGFP dimmed. Scale bar = 2 μm. (B) The overall ratio of STIM1-containing protrusions in 10, 15, and 20 DIV is shown in absolute values. The total number of protrusions per standard field (filopodia and spine-like structures) are shown for all three ages (n = 40 fields for each age). (C) The normalized proportion of STIM1-positive protrusions as a percent of the total number of protrusions per field. (D) The appearance of new protrusions, associated with STIM1 puncta for DIV 10, 15, and 20 in the standard field per 30 min is summarized. **Very significant, 0.01 > p > 0.001; ***highly significant, p < 0.001.
Figure 5
Figure 5
Motility of STIM1 puncta along a dendrite and their association with a transient rise of [Ca2+]i. (A) Three images of a dendritic segment containing one stable STIM1 puncta, and a mobile one moving from left to right. (B) Fluo2 sensor shows calcium transients. Panels (B1–3) show calcium transient in the area, marked with an arrowhead. The current location of the mobile STIM1 punctum is marked with a red contour. The second red contour corresponds to the stable STIM1 punctum. (C) When punctum is present at the red location on the right a calcium transient can be detected. (D) In an adjacent location, neither puncta nor calcium transient is seen. Averaged data, n = 10 regions from different cells and different cultures. Three time points are taken: right before the entrance of puncta into the selected region (before) in the presence of puncta within the region of interest (during) and right after the puncta left the region (after). Simultaneously, measurements from a randomly selected nearby region were made (nearby). STIM1 for these time points (E, red). Nearby region (E, gray). Calcium for these time points (F, dark green). Calcium measurements from a nearby region (F, light green). (G) Time course of change in [Ca2+]i fluorescence at the STIM1 puncta (top, green) and the STIM1 fluorescence (red, low trace) of 10 dendrites. Note that STIM1 fluorescence precedes the rise of [Ca2+]i and is sustained after the calcium change subsided. (H) A fast synapse-evoked [Ca2+]i rise that is not associated with a change in STIM fluorescence. Note the much faster time course of change in the synaptic event compared to the change seen above. (I) Movement rates (μm/50 s of three sizes of STIM1 puncta (large: >2 μm, medium: 1–2 μm and small: <1 μm), at three age groups, 10, 15 and 20 DIV. Small puncta move faster than medium and large ones at all age groups (p < 0.05). The faster movement rate is observed at 15 DIV compared to 10 and 20 DIVs for both medium and small-sized STIM1 puncta (medium: n = 27, 19 and 17 for 10, 15 and 20 DIV, respectively, F = 3.58, p < 0.05; small: n = 27, 14 and 8, F = 3.02, p < 0.05). *Significant, 0.05 > p > 0.01; **very significant, 0.01 > p > 0.001; n.s., not significant, p ≥ 0.05.
Figure 6
Figure 6
Effects of tetrodotoxin (TTX) on STIM1-associated calcium transients and the formation of nascent filopodia. (A) Sample illustration of a dendrite at four time-points, 10 s apart, from top to bottom, showing calcium transients (green), associated with STIM1 puncta (red) in EBFP-transfected neuron (blue), recorded in TTX. Some calcium transients in the dendrite are associated with filopodia outgrowth (arrowheads). (B) The number of calcium transients during 5 min per standard segment is measured in control and TTX (n = 20 fields, seven cells for each). (C) Averaged duration of events (n = 40 events, 20 fields for each) scale = secs. (D) Averaged amplitude of events (n = 40 events, 20 fields for each). (E) All related to filopodia outgrowth: new filopodia per 30 min per standard segment, associated with STIM1 puncta and calcium transients (n = 40 fields, seven cells for each). (F) Percent of new filopodia associated with STIM1, of total new filopodia per standard field (n = 40 fields). (G) Averaged persistence of new filopodia in time (seconds; n = 55 protrusions for each). *Significant, 0.05 > p > 0.01; ***highly significant, p < 0.001; n.s., not significant, p ≥ 0.05.
Figure 7
Figure 7
STIM2-YFP puncta movement in relation to [Ca2+]i transients. (A) Sample illustration of stable and mobile STIM2-YFP (green) puncta over 500 s, DIV 10. Cell morphology marked with EBFP (blue). Overall number of motile/stable puncta per segments of 50 μm: DIV 10: 0.4 ± 0.2/3.3 ± 0.4 (nine cells, n = 14 segments); DIV 15: 0.5 ± 0.4/3.4 ± 0.4 (six cells, n = 13 segments); DIV 20: 0.9 ± 0.3/4.3 ± 0.2 (six cells, n = 10 segments). (B) Same dendritic segment with Calcium Orange (CO) fluorescence (red). Two regions are marked with yellow and white circles: with punctum and nearby regions, respectively. Panels (B1–3) show the region marked with arrowhead before, during, and after the entrance of the STIM2 punctum (yellow contour). Stable punctum contour is shown on the left. (C) Corresponding graph demonstrating the change in STIM2 (red) and CO (green) fluorescence over time inside the marked region. (D) A nearby region without STIM2 and the corresponding traces. (E) Averaged mobile STIM2 fluorescence before, during, and after the entrance into the region of interest (left, red columns) and in the nearby region (gray). All for DIV 10. n = 6 paired region, five cells. (F) CO fluorescence for same times and regions as in (E). (G) Sample STIM1 puncta fluorescence over time inside the marked region for comparison vs. STIM2: a calcium transient can be detected (Fluo-2, green trace). (H) Averaged rate of motility per 50 s, DIV 15, regardless of size puncta, STIM1: 5.9 μm ± 0.8, n = 27 representative motile puncta from nine cells; STIM2: 0.9 μm ± 0.1, n = 20 representative motile puncta from eight cells. Note that the motility of STIM2 puncta is much lower that of STIM1, difference highly significant, t = 6.39, p < 0.001. (I) Example of a cell at 10 DIV, co-transfected with STIM1 (red) and STIM2 (green). EBFP for cell morphology (blue). (J) Example of filopodia spontaneous outgrowth at DIV 10, over 1,000 s in STIM2 transfected neuron (green). Note the lack of association of the growth with STIM2. **Very significant, 0.01 > p > 0.001; ***highly significant, p < 0.001; n.s., not significant, p ≥ 0.05.
Figure 8
Figure 8
Motility of STIM1 punctum is correlated with local calcium sparks. (A) Movement of a STIM1 punctum from region 1 to region 2 (top left, as in Figure 6) and by comparison to an adjacent region, where no STIM1 puncta are detected (top right). Below, calcium fluctuations in the corresponding region 1 and nearby quiet region, and calcium fluctuation in region 2 to where the STIM1 punctum moved. (B) Averaged fluorescence of STIM1 and corresponding Fluo2 fluorescence in the two positions where STIM1 was detected. (C) Expanded traces taken from region#1 in the presence (left) and absence (right) of STIM1 punctum. Two lines are drawn at 2 SD from the mean, and deviations of the calcium fluorescence line above the regions are marked with green arrows. (D) Average fluorescence of STIM1 and Ca2+ level in regions of stable puncta and nearby region in 10 s; the number of Ca2+ bursts in 20 s, n = 9 cells, DIV 15. *Significant, 0.05 > p > 0.01; ***highly significant, p < 0.001; n.s., not significant, p ≥ 0.05.

Similar articles

Cited by

References

    1. Baba A., Yasui T., Fujisawa S., Yamada R. X., Yamada M. K., Nishiyama N., et al. . (2003). Activity-evoked capacitative Ca2+ entry: implications in synaptic plasticity. J. Neurosci. 23, 7737–7741. 10.1523/JNEUROSCI.23-21-07737.2003 - DOI - PMC - PubMed
    1. Bogeski I., Kilch T., Niemeyer B. A. (2012). ROS and SOCE: recent advances and controversies in the regulation of STIM and Orai. J. Physiol. 590, 4193–4200. 10.1113/jphysiol.2012.230565 - DOI - PMC - PubMed
    1. Dittmer P. J., Wild A. R., Dell’Acqua M. L., Sather W. A. (2017). STIM1 Ca2+ sensor control of L-type Ca2+ channel-dependent dendritic spine structural plasticity and nuclear signaling. Cell Rep. 19, 321–334. 10.1016/j.celrep.2017.03.056 - DOI - PMC - PubMed
    1. Feske S., Gwack Y., Prakriya M., Srikanth S., Puppel S. H., Tanasa B., et al. . (2006). A mutation in Orai1 causes immune deficiency by abrogating CRAC channel function. Nature 441, 179–185. 10.1038/nature04702 - DOI - PubMed
    1. Fishbein I., Segal M. (2007). Miniature synaptic currents become neurotoxic to chronically silenced neurons. Cereb. Cortex 17, 1292–1306. 10.1093/cercor/bhl037 - DOI - PubMed

LinkOut - more resources