

A multi-omics study on cutaneous and uveal melanoma
- PMID: 33469481
- PMCID: PMC7790682
- DOI: 10.18240/ijo.2021.01.05
A multi-omics study on cutaneous and uveal melanoma
Abstract
Aim: To present the multi-omics landscape of cutaneous melanoma (CM) and uveal melanoma (UM) from The Cancer Genome Atlas (TCGA).
Methods: The differentially expressed genes (DEGs) between CM and UM were found and integrated into a gene ontology enrichment analysis. Besides, the differentially expressed miRNAs were also identified. We also compared the methylation level of CM with UM and identified the differentially methylated regions to integrate with the DEGs to display the relationship between the gene expression and DNA methylation. The differentially expressed transcription factors (TFs) were identified.
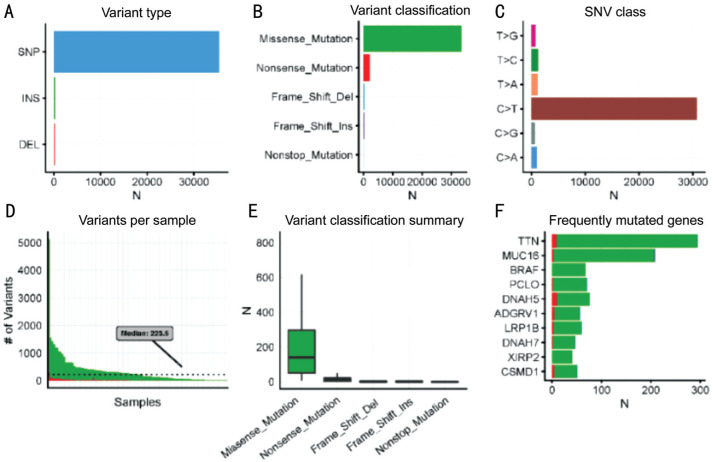
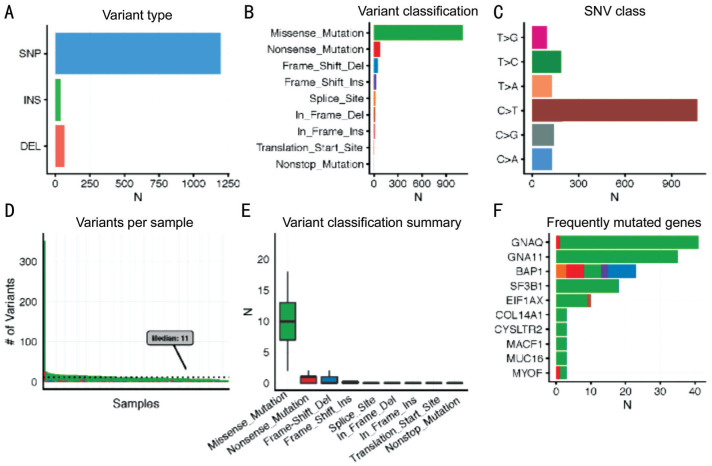
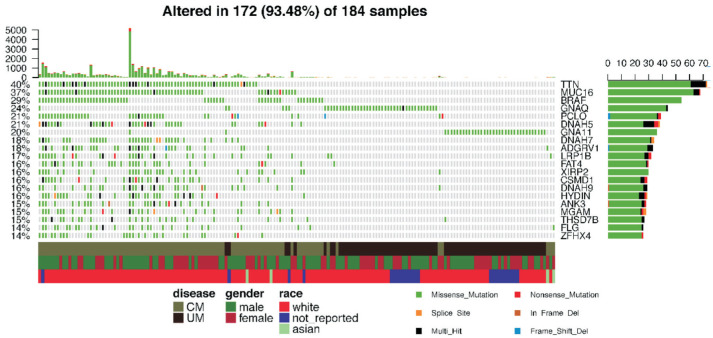
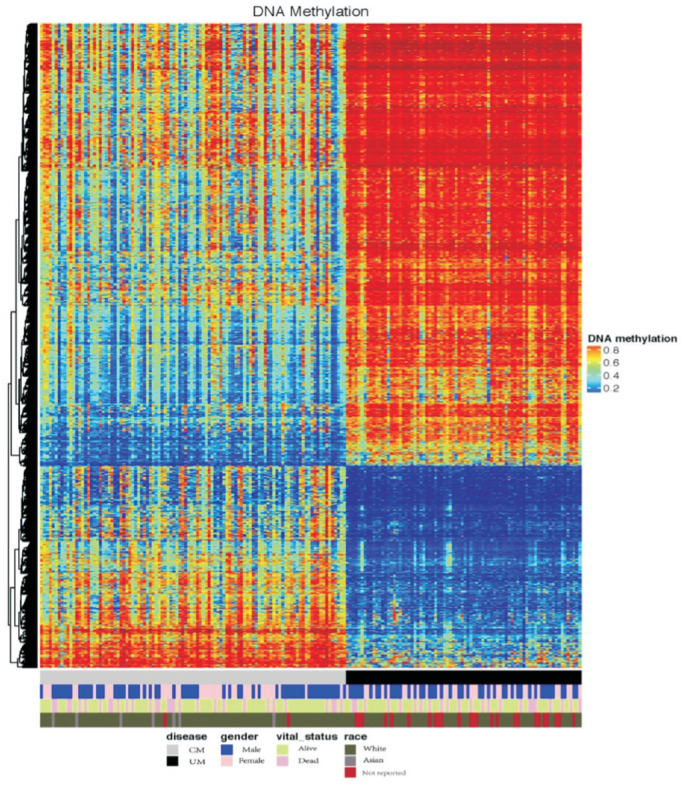
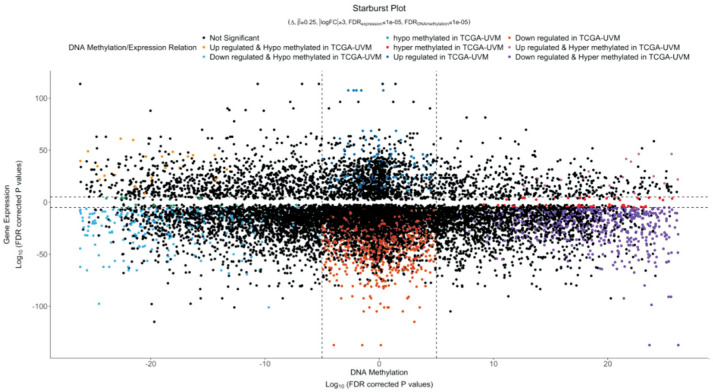
Results: Though CM had more mutational burden than UM, they shared several similarities such as the same rankings in diverse variant types. Except GNAQ and GNA11, the other top 18 mutated genes of the combined group were mostly detected in CM instead of UM. On the transcriptomic level, 4610 DEGs were found and integrated into a gene ontology enrichment analysis. We also identified 485 differentially expressed miRNAs. The methylation analysis showed that UM had a significantly higher methylation level than CM. The integration of differentially methylated regions and DEGs demonstrated that most DEGs were downregulated in UM and the hypo- and hypermethylation presented no obvious difference within these DEGs. Finally, 116 hypermethylated TFs and 114 hypomethylated TFs were identified as differentially expressed TFs in CM when compared with UM.
Conclusion: This multi-omics study on comparing CM with UM confirms that they differ in all analyzed levels. Of notice, the results also offer new insights with implications for elucidating certain unclear problems such as the distinct role of epithelial mesenchymal transition in two melanomas, the different metastatic routes of CM and UM and the liver tropism of metastatic UM.
Keywords: cutaneous melanoma; epigenetics; genomics; transcriptomics; uveal melanoma.
International Journal of Ophthalmology Press.
Figures
References
-
- Belmar-Lopez C, Mancheno-Corvo P, Saornil MA, Baril P, Vassaux G, Quintanilla M, Martin-Duque P. Uveal vs. cutaneous melanoma. Origins and causes of the differences. Clin Transl Oncol. 2008;10(3):137–142. - PubMed
-
- Leiserson MDM, Vandin F, Wu HT, Dobson JR, Eldridge JV, Thomas JL, Papoutsaki A, Kim Y, Niu BF, McLellan M, Lawrence MS, Gonzalez-Perez A, Tamborero D, Cheng YW, Ryslik GA, Lopez-Bigas N, Getz G, Ding L, Raphael BJ. Pan-cancer network analysis identifies combinations of rare somatic mutations across pathways and protein complexes. Nat Genet. 2015;47(2):106–114. - PMC - PubMed
-
- Liu J, Lichtenberg T, Hoadley KA, Poisson LM, Lazar AJ, Cherniack AD, Kovatich AJ, Benz CC, Levine DA, Lee AV, Omberg L, Wolf DM, Shriver CD, Thorsson V, Cancer Genome Atlas Research Network. Hu H. An integrated TCGA pan-cancer clinical data resource to drive high-quality survival outcome analytics. Cell. 2018;173(2):400–416.e11. - PMC - PubMed
LinkOut - more resources
Full Text Sources
Other Literature Sources