

This is a preprint.
The National COVID Cohort Collaborative: Clinical Characterization and Early Severity Prediction
- PMID: 33469592
- PMCID: PMC7814838
- DOI: 10.1101/2021.01.12.21249511
The National COVID Cohort Collaborative: Clinical Characterization and Early Severity Prediction
Update in
-
Clinical Characterization and Prediction of Clinical Severity of SARS-CoV-2 Infection Among US Adults Using Data From the US National COVID Cohort Collaborative.JAMA Netw Open. 2021 Jul 1;4(7):e2116901. doi: 10.1001/jamanetworkopen.2021.16901. JAMA Netw Open. 2021. PMID: 34255046 Free PMC article.
Abstract
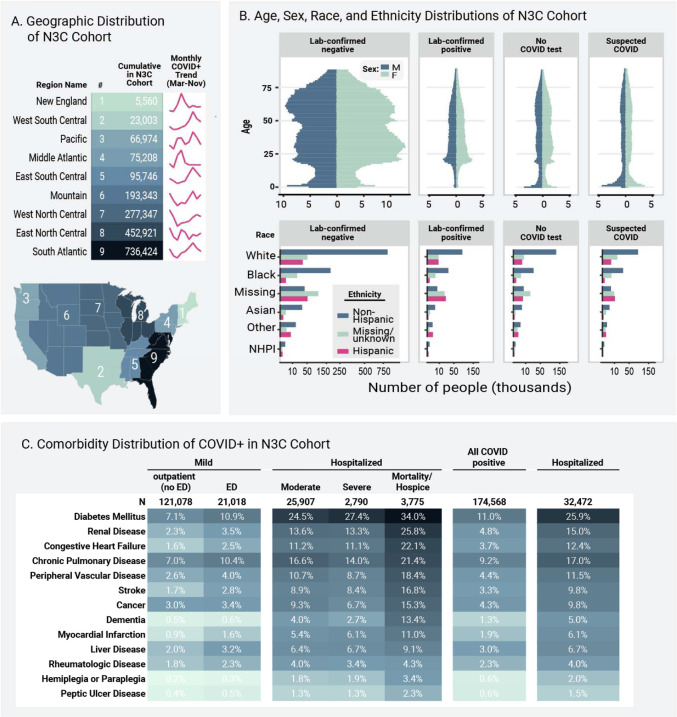
Background: The majority of U.S. reports of COVID-19 clinical characteristics, disease course, and treatments are from single health systems or focused on one domain. Here we report the creation of the National COVID Cohort Collaborative (N3C), a centralized, harmonized, high-granularity electronic health record repository that is the largest, most representative U.S. cohort of COVID-19 cases and controls to date. This multi-center dataset supports robust evidence-based development of predictive and diagnostic tools and informs critical care and policy.
Methods and findings: In a retrospective cohort study of 1,926,526 patients from 34 medical centers nationwide, we stratified patients using a World Health Organization COVID-19 severity scale and demographics; we then evaluated differences between groups over time using multivariable logistic regression. We established vital signs and laboratory values among COVID-19 patients with different severities, providing the foundation for predictive analytics. The cohort included 174,568 adults with severe acute respiratory syndrome associated with SARS-CoV-2 (PCR >99% or antigen <1%) as well as 1,133,848 adult patients that served as lab-negative controls. Among 32,472 hospitalized patients, mortality was 11.6% overall and decreased from 16.4% in March/April 2020 to 8.6% in September/October 2020 (p = 0.002 monthly trend). In a multivariable logistic regression model, age, male sex, liver disease, dementia, African-American and Asian race, and obesity were independently associated with higher clinical severity. To demonstrate the utility of the N3C cohort for analytics, we used machine learning (ML) to predict clinical severity and risk factors over time. Using 64 inputs available on the first hospital day, we predicted a severe clinical course (death, discharge to hospice, invasive ventilation, or extracorporeal membrane oxygenation) using random forest and XGBoost models (AUROC 0.86 and 0.87 respectively) that were stable over time. The most powerful predictors in these models are patient age and widely available vital sign and laboratory values. The established expected trajectories for many vital signs and laboratory values among patients with different clinical severities validates observations from smaller studies, and provides comprehensive insight into COVID-19 characterization in U.S. patients.
Conclusions: This is the first description of an ongoing longitudinal observational study of patients seen in diverse clinical settings and geographical regions and is the largest COVID-19 cohort in the United States. Such data are the foundation for ML models that can be the basis for generalizable clinical decision support tools. The N3C Data Enclave is unique in providing transparent, reproducible, easily shared, versioned, and fully auditable data and analytic provenance for national-scale patient-level EHR data. The N3C is built for intensive ML analyses by academic, industry, and citizen scientists internationally. Many observational correlations can inform trial designs and care guidelines for this new disease.
Conflict of interest statement
Declaration of interests Benjamin Amor, Katie Rebecca Bradwell, Andrew T. Girvin, Amin Manna, and Nabeel Qureshi: employee of Palantir Technologies; Brian T. Garibaldi: Member of the FDA Pulmonary-Allergy Drugs Advisory Committee (PADAC); Matvey B. Palchuk: employee of TriNetX; Kristin Kostka: employee of IQVIA Inc.; Julie A. McMurry: and Melissa A. Haendel Cofounders of Pryzm Health; Chris P. Austin and Ken R. Gersing, employees of the National Institutes of Health. No conflicts of interest reported for all other authors.
Figures


References
Publication types
Grants and funding
- UL1 TR003096/TR/NCATS NIH HHS/United States
- UL1 TR002649/TR/NCATS NIH HHS/United States
- P30 ES001247/ES/NIEHS NIH HHS/United States
- UL1 TR002535/TR/NCATS NIH HHS/United States
- U54 GM104942/GM/NIGMS NIH HHS/United States
- UL1 TR001420/TR/NCATS NIH HHS/United States
- UL1 TR002240/TR/NCATS NIH HHS/United States
- UL1 TR001439/TR/NCATS NIH HHS/United States
- UL1 TR001998/TR/NCATS NIH HHS/United States
- UL1 TR002537/TR/NCATS NIH HHS/United States
- UL1 TR001857/TR/NCATS NIH HHS/United States
- P30 DK092926/DK/NIDDK NIH HHS/United States
- UL1 TR002494/TR/NCATS NIH HHS/United States
- UL1 TR002736/TR/NCATS NIH HHS/United States
- UL1 TR002538/TR/NCATS NIH HHS/United States
- U54 GM115458/GM/NIGMS NIH HHS/United States
- DP5 OD021338/OD/NIH HHS/United States
- UL1 TR001453/TR/NCATS NIH HHS/United States
- UL1 TR002489/TR/NCATS NIH HHS/United States
- UL1 TR003107/TR/NCATS NIH HHS/United States
- UL1 TR003015/TR/NCATS NIH HHS/United States
- UL1 TR002733/TR/NCATS NIH HHS/United States
- U24 TR002306/TR/NCATS NIH HHS/United States
- UL1 TR001876/TR/NCATS NIH HHS/United States
- UL1 TR002003/TR/NCATS NIH HHS/United States
- UL1 TR002553/TR/NCATS NIH HHS/United States
- UL1 TR002389/TR/NCATS NIH HHS/United States
- UL1 TR002014/TR/NCATS NIH HHS/United States
- UL1 TR002373/TR/NCATS NIH HHS/United States
- UL1 TR002319/TR/NCATS NIH HHS/United States
- UL1 TR001855/TR/NCATS NIH HHS/United States
- UL1 TR002345/TR/NCATS NIH HHS/United States
- UL1 TR001450/TR/NCATS NIH HHS/United States
- UL1 TR002377/TR/NCATS NIH HHS/United States
- K23 HL128909/HL/NHLBI NIH HHS/United States
- UL1 TR002544/TR/NCATS NIH HHS/United States
- UL1 TR003098/TR/NCATS NIH HHS/United States
LinkOut - more resources
Full Text Sources
Other Literature Sources
Miscellaneous