[Preprint]. 2021 Jan 15:2021.01.12.21249683.
doi: 10.1101/2021.01.12.21249683.

Differential T cell reactivity to seasonal coronaviruses and SARS-CoV-2 in community and health care workers

Affiliations

Differential T cell reactivity to seasonal coronaviruses and SARS-CoV-2 in community and health care workers

Ricardo da Silva Antunes et al. medRxiv. .

Update in

Abstract

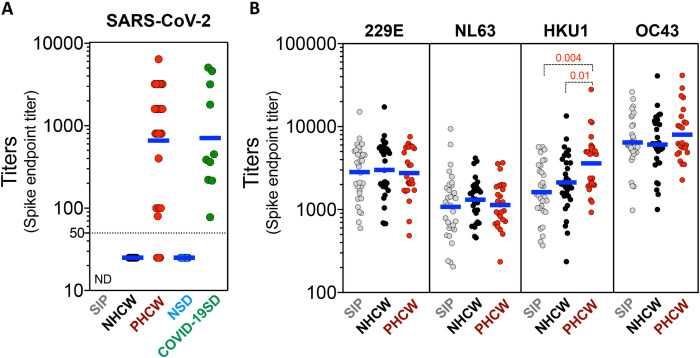
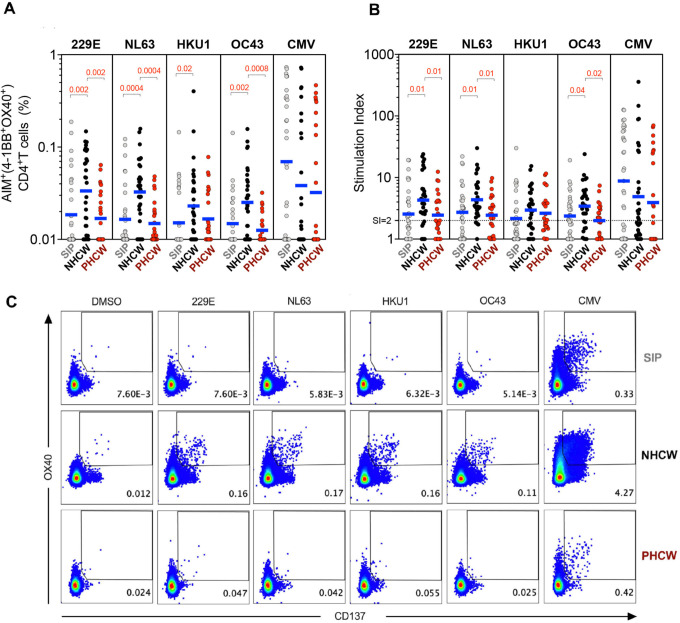
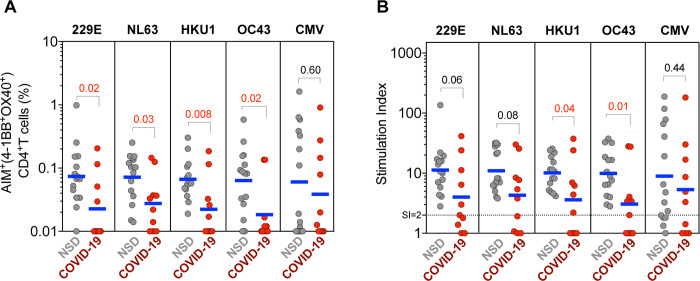
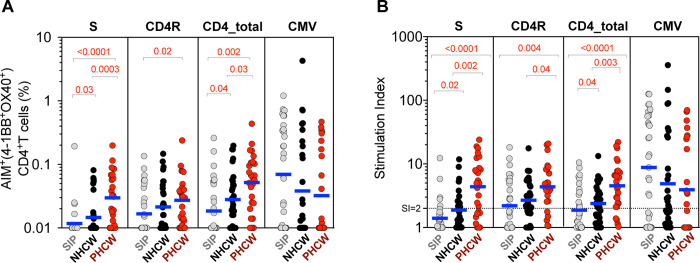
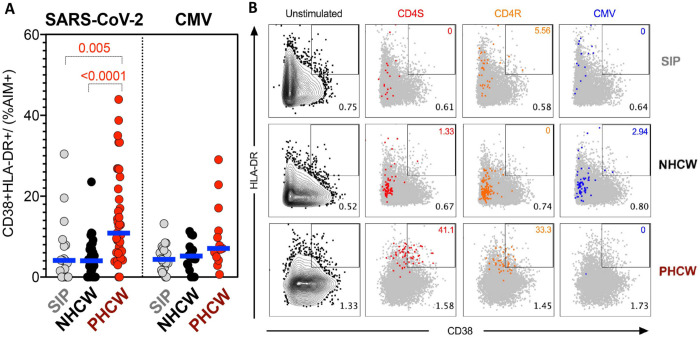
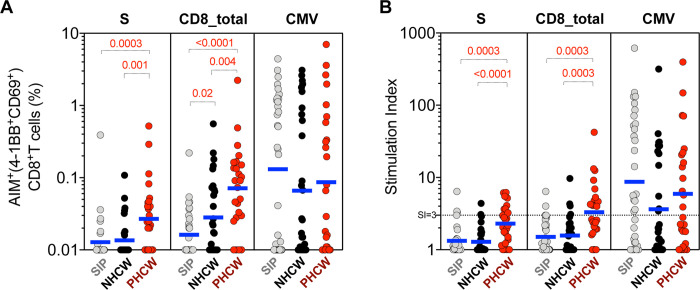
Herein we measured CD4+ T cell responses against common cold corona (CCC) viruses and SARS-CoV-2 in high-risk health care workers (HCW) and community controls. We observed higher levels of CCC reactive T cells in SARS-CoV-2 seronegative HCW compared to community donors, consistent with potential higher occupational exposure of HCW to CCC. We further show that SARS-CoV-2 reactivity of seronegative HCW was higher than community controls and correlation between CCC and SARS-CoV-2 responses is consistent with cross-reactivity and not associated with recent in vivo activation. Surprisingly, CCC reactivity was decreased in SARS-CoV-2 infected HCW, suggesting that exposure to SARS-CoV-2 might interfere with CCC responses, either directly or indirectly. This result was unexpected, but consistently detected in independent cohorts derived from Miami and San Diego.


Conflict of interest statement

Competing interests A.S. is a consultant for Gritstone, Flow Pharma, Merck, Epitogenesis, Gilead and Avalia. S.C. is a consultant for Avalia. LJI has filed for patent protection for various aspects of T cell epitope and vaccine design work. Mount Sinai has licensed serological assays to commercial entities and has filed for patent protection for serological assays. D.S., F.A., and F.K. are listed as inventors on the pending patent application (F.K.), and Newcastle disease virus (NDV)-based SARS-CoV-2 vaccines that name F.K. as inventor. Mount Sinai has licensed serological assays to commercial entities and has filed for patent protection for serological assays. D.S., F.A. and F.K. are listed as inventors on the pending patent application. All other authors declare no conflict of interest

Figures

Figure 1.
Figure 1.. SARS-CoV-2 and CCC viruses serological reactivity for the donor cohort.
(A) Serum ELISA titers to SARS-CoV-2 spike RBD protein. “ND” = Not Determined. (B) Serum ELISA titers to CCC viruses (HCoV-229E, HCoV-NL63, HCoV-HKU1 and HCoV-OC43) spike protein. Non-parametric Kruskal-Wallis multiple comparison test was applied for each individual CCC strain. Geometric mean titers are indicated and p values are shown for the statistical significant comparisons. “SIP” = Shelter In Place community volunteers (n=33). “NHCW” = SeroNegative Health Care Workers (n=31). “PHCW” = Antibody or PCR Positive Health Care Workers (n=26). “NSD” = SeroNegative San Diego (n=15). “COVID-19” = Seropositive San Diego (n=10). Dotted line indicates limit of detection (1:50).
Figure 2.
Figure 2.. CD4+ T cell immune responses to CCC epitopes from Miami are higher in NHCW.
CCC-specific CD4+ T cells (HCoV-229E, HCoV-NL63, HCoV-HKU1 and HCoV-OC43) and ubiquitous control CMV-specific CD4+ T cells were measured as percentage of AIM+ (OX40+CD137+) CD4+ T cells after stimulation of PBMCs with CCC and CMV peptide pools. (A) Data background subtracted or (B) stimulation index (SI) against DMSO negative control are shown with geometric mean for the 3 different groups. Non-parametric Kruskal-Wallis multiple comparison test was applied for each individual CCC strain and CMV. P values are shown for the statistical significant comparisons. “SIP” = Shelter In Place community volunteers (n=33). “NHCW” = SeroNegative Health Care Workers (n=31). “PHCW” = Antibody or PCR Positive Health Care Workers (n=26). (C) Representative FACS plots, gated on total CD4+ T cells for the 4 CCC in addition to the DMSO and CMV across all the cohorts. Cell frequency for AIM+ cells in the several conditions is indicated.
Figure 3.
Figure 3.. Reactivity of CD4+ T cells against CCC epitopes in an independent cohort from San Diego.
CCC-specific CD4+ T cells (HCoV-229E, HCoV-NL63, HCoV-HKU1 and HCoV-OC43) and ubiquitous control CMV-specific CD4+ T cells were measured as percentage of AIM+ (OX40+CD137+) CD4+ T cells after stimulation of PBMCs with CCC and CMV peptide pools. (A) Data background subtracted or (B) stimulation index (SI) against DMSO negative control are shown with geometric mean for the 2 different groups. Samples were from unexposed seronegative donors (“NSD”, n=15) and recovered COVID-19 patients (“COVID-19”, n=10). Statistical comparisons across cohorts were performed with the Mann-Whitney test. P values are shown with p<0.05 defined as statistical significant.
Figure 4.
Figure 4.. CD4+ T cell response to SARS-CoV-2 epitopes highest in PHCW and lowest in SIP.
SARS-CoV-2-specific CD4+ T cells were measured as percentage of AIM+ (OX40+CD137+) CD4+ T cells after stimulation of PBMCs with peptide pools encompassing spike (“S”) or representing all the proteome without spike (“CD4R”). Graphs show data for specific responses against S, CD4R or the combination of both (CD4-total) and against CMV as a control, and plotted as (A) background subtracted or (B) as stimulation index (SI) against DMSO negative control. Geometric mean for the 3 different groups is shown. Non-parametric Kruskal-Wallis multiple comparison test was applied. P values are shown for the statistical significant comparisons. “SIP” = Shelter In Place community volunteers (n=33). “NHCW” = SeroNegative Health Care Workers (n=31). “PHCW” = Antibody or PCR Positive Health Care Workers (n=26).
Figure 5.
Figure 5.. Highest PHCW reactivity in CD4+ T cell responses associated with recent infection.
(A) Recently activated SARS-CoV-2-specific CD4+ T cells were measured as percentage of CD38+/HLA-DR+ cells in AIM+ (OX40+CD137+) CD4+ T cells after stimulation of PBMCs with peptide pools encompassing a spike only (“S”) MP and MP representing all the proteome without spike (“CD4R”). Graphs show data for specific responses against SARS-CoV-2 (both “S” and “CD4R”) the ubiquitous pathogen CMV of responses with SI>2. Each dot represents the response of an individual subject to an individual pool. Geometric mean for the 3 different groups is shown. Non-parametric Kruskal-Wallis multiple comparison test was applied. P values are shown for the statistical significant comparisons. “SIP” = Shelter In Place community volunteers (n=20). “NHCW” = SeroNegative Health Care Workers (n=33). “PHCW” = Antibody or PCR Positive Health Care Workers (n=39). (B) Representative FACS plots of HLA-DR/CD38+ cells in AIM+ (OX40+CD137+) CD4+ T cells (colored) overlapped with total HLA-DR/CD38 expression (grey) for all the cohorts in the different unstimulated or stimulated conditions. Cell frequency of HLA-DR/CD38+ in AIM+ cells or total CD4+ T cells is indicated on the top and bottom right corner respectively.
Figure 6.
Figure 6.. CD8+ T cell response to SARS-CoV-2 epitopes highest in PHCW and lowest in SIP.
SARS-CoV-2-specific CD8+ T cells were measured as percentage of AIM+ (CD69+CD137+) CD8+ T cells after stimulation of PBMCs with spike only (“S”) MP or class I MPs (CD8A, CD8B). Graphs show data for specific responses against S, the combination of both CD8 MPs (CD8-total) and against CMV as a control, and plotted as (A) background subtracted or (B) as stimulation index (SI) against DMSO negative control. Geometric mean for the 3 different groups is shown. Non-parametric Kruskal-Wallis multiple comparison test was applied. P values are shown for the statistical significant comparisons. “SIP” = Shelter In Place community volunteers (n=33). “NHCW” = SeroNegative Health Care Workers (n=31). “PHCW” = Antibody or PCR Positive Health Care Workers (n=26).

Similar articles

References

    1. Nguyen LH, Drew DA, Graham MS, Joshi AD, Guo CG, Ma W, et al. Risk of COVID-19 among front-line health-care workers and the general community: a prospective cohort study. Lancet Public Health. 2020;5(9):e475–e83. - PMC - PubMed
    1. Iversen K, Bundgaard H, Hasselbalch RB, Kristensen JH, Nielsen PB, Pries-Heje M, et al. Risk of COVID-19 in health-care workers in Denmark: an observational cohort study. Lancet Infect Dis. 2020. - PMC - PubMed
    1. Moscola J, Sembajwe G, Jarrett M, Farber B, Chang T, McGinn T, et al. Prevalence of SARS-CoV-2 Antibodies in Health Care Personnel in the New York City Area. JAMA. 2020;324(9):893–5. - PMC - PubMed
    1. Rudberg AS, Havervall S, Manberg A, Jernbom Falk A, Aguilera K, Ng H, et al. SARS-CoV-2 exposure, symptoms and seroprevalence in healthcare workers in Sweden. Nat Commun. 2020;11(1):5064. - PMC - PubMed
    1. Zhang S, Guo M, Wu F, Xiong N, Ma Y, Wang Z, et al. Factors associated with asymptomatic infection in health-care workers with severe acute respiratory syndrome coronavirus 2 infection in Wuhan, China: a multicentre retrospective cohort study. Clin Microbiol Infect. 2020. - PMC - PubMed

Publication types