[Preprint]. 2021 Oct 11:2021.01.14.21249839.
doi: 10.1101/2021.01.14.21249839.

Innate lymphoid cells and disease tolerance in SARS-CoV-2 infection

Affiliations

Innate lymphoid cells and disease tolerance in SARS-CoV-2 infection

Noah J Silverstein et al. medRxiv. .

Update in

  • Innate lymphoid cells and COVID-19 severity in SARS-CoV-2 infection.
    Silverstein NJ, Wang Y, Manickas-Hill Z, Carbone C, Dauphin A, Boribong BP, Loiselle M, Davis J, Leonard MM, Kuri-Cervantes L; MGH COVID-19 Collection & Processing Team; Meyer NJ, Betts MR, Li JZ, Walker BD, Yu XG, Yonker LM, Luban J. Silverstein NJ, et al. Elife. 2022 Mar 11;11:e74681. doi: 10.7554/eLife.74681. Elife. 2022. PMID: 35275061 Free PMC article.

Abstract

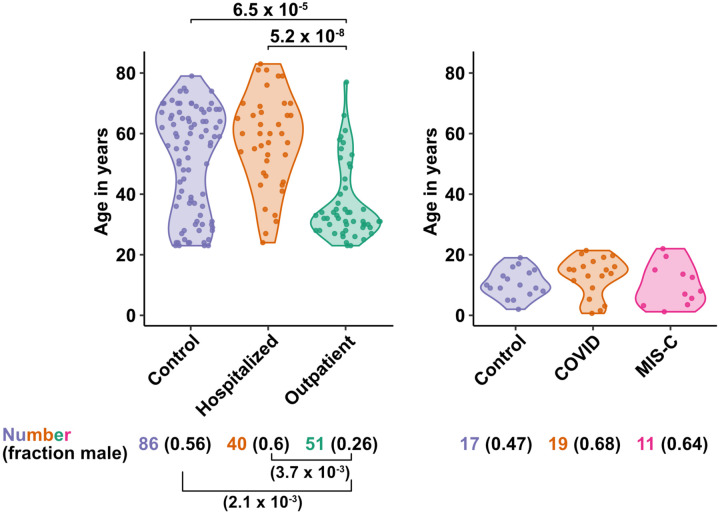
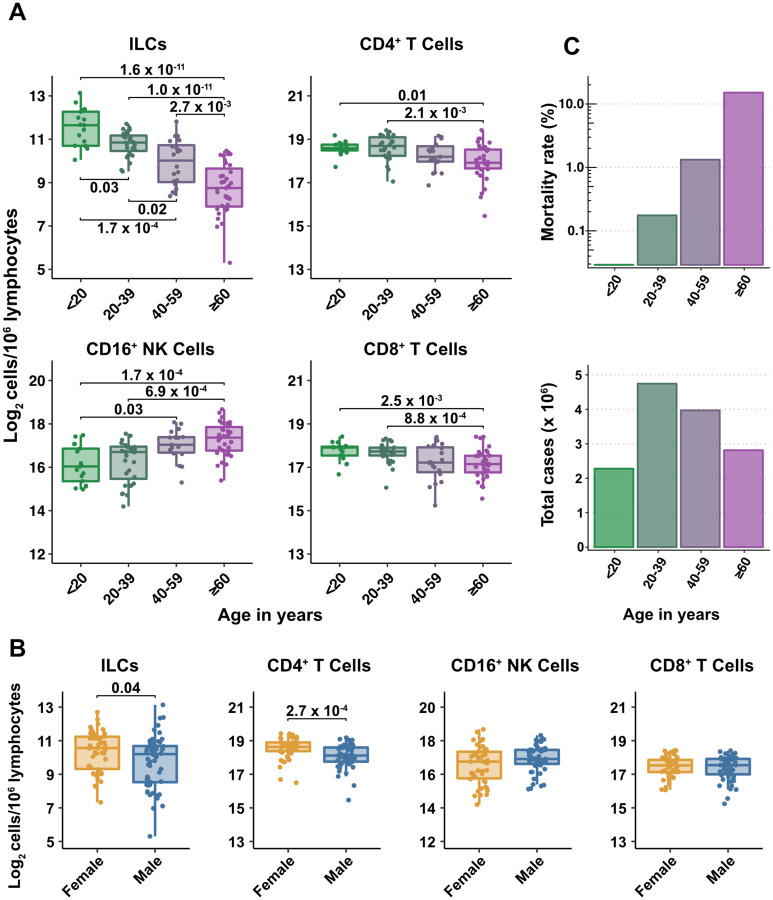
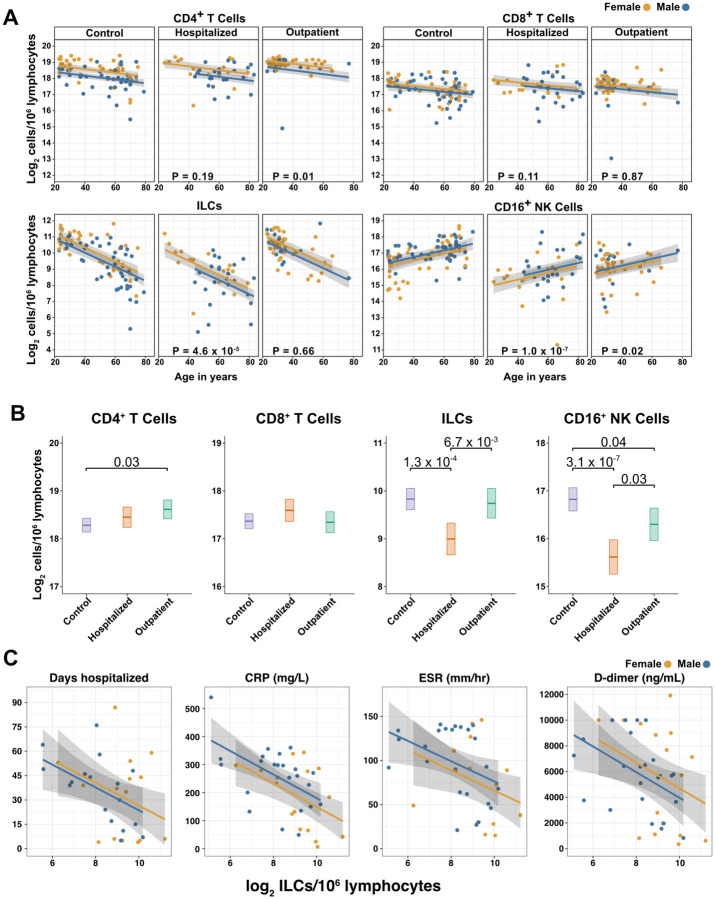
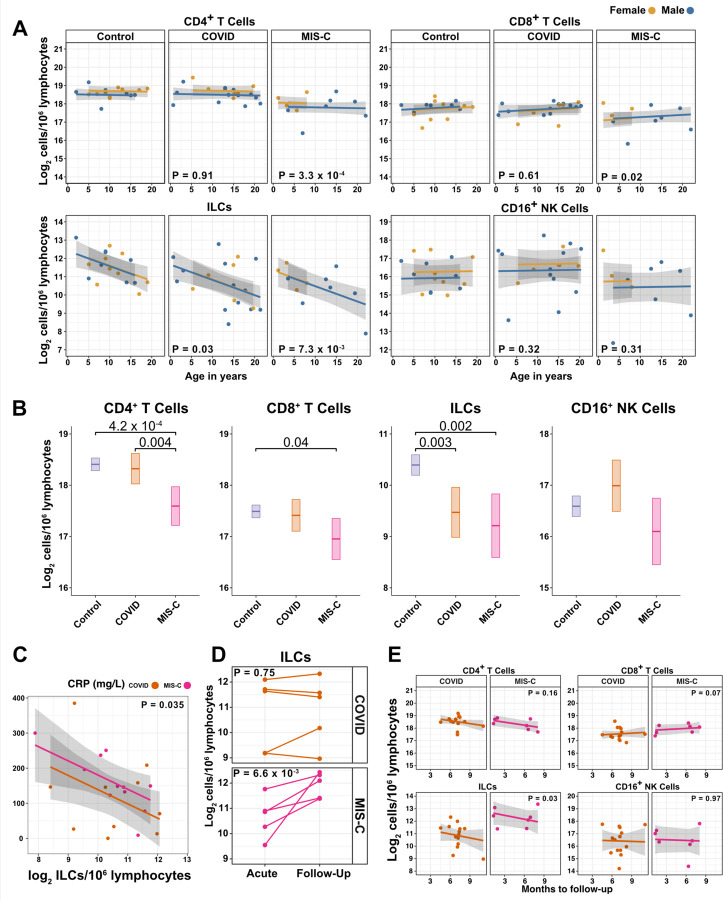
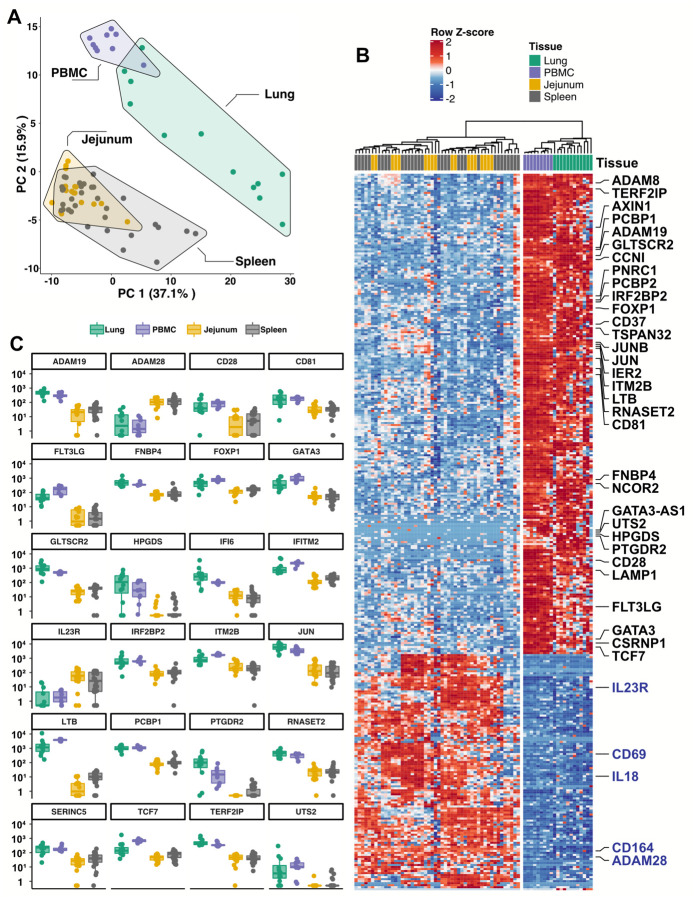
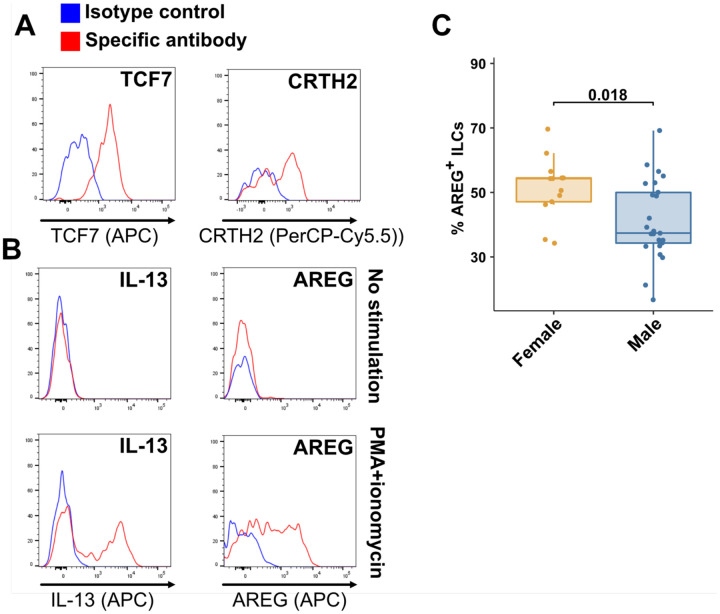
Risk of severe COVID-19 increases with age, is greater in males, and is associated with lymphopenia, but not with higher burden of SARS-CoV-2. It is unknown whether effects of age and sex on abundance of specific lymphoid subsets explain these correlations. This study found that the abundance of innate lymphoid cells (ILCs) decreases more than 7-fold over the human lifespan - T cell subsets decrease less than 2-fold - and is lower in males than in females. After accounting for effects of age and sex, ILCs, but not T cells, were lower in adults hospitalized with COVID-19, independent of lymphopenia. Among SARS-CoV-2-infected adults, the abundance of ILCs, but not of T cells, correlated inversely with odds and duration of hospitalization, and with severity of inflammation. ILCs were also uniquely decreased in pediatric COVID-19 and the numbers of these cells did not recover during follow-up. In contrast, children with MIS-C had depletion of both ILCs and T cells, and both cell types increased during follow-up. In both pediatric COVID-19 and MIS-C, ILC abundance correlated inversely with inflammation. Blood ILC mRNA and phenotype tracked closely with ILCs from lung. Importantly, blood ILCs produced amphiregulin, a protein implicated in disease tolerance and tissue homeostasis, and the percentage of amphiregulin-producing ILCs was higher in females than in males. These results suggest that, by promoting disease tolerance, homeostatic ILCs decrease morbidity and mortality associated with SARS-CoV-2 infection, and that lower ILC abundance accounts for increased COVID-19 severity with age and in males.


Figures

Fig. 1.
Fig. 1.. Age and sex of control and SARS-CoV-2-infected blood donors
Age of the subjects is shown, along with the number of subjects and fraction male in each group, for adult (left) and pediatric (right) cohorts, as indicated. P-values are from pairwise, two-sided, Wilcoxon rank-sum test for ages and Fisher’s exact test for fraction male, with Bonferroni correction for multiple comparisons. Adjusted P-values < 0.05 are shown.
Fig. 2.
Fig. 2.. Blood ILC abundance decreases exponentially across the lifespan mirroring the mortality rate from SARS-CoV-2 infection
(A–B) Log2 abundance per million lymphocytes of the indicated lymphoid cell populations in combined pediatric and adult control data plotted by 20-year bin or by sex, as indicated. Each dot represents an individual blood donor. Boxplots represent the distribution of the data with the center line drawn through the median with the upper and lower bounds of the box at the 75th and 25th percentiles respectively. The upper and lower whiskers extend to the largest or smallest values within 1.5 x the interquartile range (IQR). P-values are from two-sided, Wilcoxon rank-sum tests with Bonferroni correction for multiple comparisons. Adjusted P-values < 0.05 are shown. (C) Case numbers and mortality rate within the indicated age ranges for cases reported in the United States between Jan 1, 2020, and June 6, 2021.
Fig. 3.
Fig. 3.. Innate lymphoid cells are depleted in adults hospitalized with COVID-19 and ILC abundance correlates inversely with disease severity.
(A) Effect of age (X-axis) on log2 abundance per million total lymphocytes of the indicated lymphoid cell populations (Y-axis), as determined by the regression analysis in Table 2. Each dot represents an individual blood donor, with yellow for female and blue for male. Shading represents the 95%CI. P-values are from the regression analysis for comparisons to the control group. (B) Log2 abundance per million lymphocytes of the indicated lymphoid cell populations, shown as estimated marginal means with 95%CI, generated from the multiple linear regressions in Table 2, and averaged across age and sex. P-values represent pairwise comparisons on the estimated marginal means, adjusted for multiple comparisons with the Tukey method. Adjusted P-values < 0.05 are shown. (C) Association of the indicated clinical parameters with log2 abundance of ILCs per million lymphoid cells. Regression lines are from simplified multiple regression models to permit visualization on a two-dimensional plane. Shading represents the 95%CI. Results of the full models accounting for effects of both age and sex, are reported in Table 4 and the text.
Fig. 4.
Fig. 4.. ILCs are depleted in children with COVID-19 or MIS-C
(A) Effect of age (X-axis) on log2 abundance per million lymphocytes of the indicated lymphoid cell populations (Y-axis), as determined by the regression analysis in Table 5. Each dot represents an individual blood donor, with yellow for female and blue for male. Shading represents the 95%CI. P-values are from the regression analysis for comparisons to the control group. (B) Log2 abundance per million lymphocytes of the indicated lymphoid cell populations, shown as estimated marginal means with 95%CI, generated from the multiple linear regressions in Table S6 that included the combined pediatric and adult control data, and averaged across age and sex. P-values represent pairwise comparisons on the estimated marginal means, adjusted for multiple comparisons with the Tukey method. Adjusted P-values < 0.05 are shown. (C) Association of CRP with log2 abundance of ILCs per million lymphocytes. Shading represents the 95%CI. Each dot represents a single blood donor, orange for COVID-19, magenta for MIS-C. P-value is for the effect of ILC abundance on CRP as determined by linear regression. (D) Log2 ILC abundance per million lymphocytes in longitudinal pairs of samples collected during acute presentation and during follow-up, from individual children with COVID-19 or MIS-C. Each pair of dots connected by a line represents an individual blood donor. P-values are for change in ILC abundance at follow-up, as determined with a linear mixed model, adjusting for age, sex, and group, and with patient as a random effect. (E) Effect of time to follow-up (X-axis) on log2 abundance per million lymphocytes of the indicated lymphoid cell populations (Y-axis). P-values are for the difference between the COVID-19 and MIS-C follow-up groups, independent of time to follow-up as determined by linear regression. Shading represents the 95%CI.
Fig. 5.
Fig. 5.. Blood ILCs are transcriptionally similar to lung ILCs
RNA-seq of ILCs sorted from blood of 9 SARS-CoV-2-uninfected controls in comparison to RNA-seq data of ILCs sorted from jejunum, lung, and spleen. (A) PCA plot of first two principal components calculated from the top 250 most variable genes across all samples. Each dot represents an individual sample with blue for ILCs sorted from blood, green for lung, yellow for jejunum, and grey for spleen. (B) Heatmap of 355 genes differentially expressed (fold-change > 1.5, padj < 0.01 as determined with DESeq2) between either blood or lung ILCs and ILCs from the other tissues. (C) Select genes from (B) plotted as deseq2 normalized counts. Each dot represents an individual sample with blue for ILCs sorted from blood, green for lung, yellow for jejunum, and grey for spleen. Boxplots represent the distribution of the data with the center line drawn through the median with the upper and lower bounds of the box at the 75th and 25th percentiles respectively. The upper and lower whiskers extend to the largest or smallest values within 1.5 x the interquartile range (IQR).
Fig. 6.
Fig. 6.. Peripheral blood ILCs exhibit homeostatic ILC2 functions
(A–B) Flow cytometry for the indicated proteins. Cells in (A) were assayed at steady-state and cells in (B) were assayed either at steady-state or after stimulation with PMA and ionomycin, as indicated. Detection of surface proteins was performed on ILCs gated as LinCD56CD127+ and detection of intracellular proteins was performed on ILCs gated as LinTBX21CD127+. (C) Percent of AREG+ ILCs in blood of control blood donors after stimulation with PMA and ionomycin. Each dot represents an individual blood donor. Boxplots represent the distribution of the data with the center line drawn through the median with the upper and lower bounds of the box at the 75th and 25th percentiles respectively. The upper and lower whiskers extend to the largest or smallest values within 1.5 x the interquartile range (IQR). P-value is from a two-sided, Wilcoxon rank-sum test.

References

    1. Alghamdi IG, Hussain II, Almalki SS, Alghamdi MS, Alghamdi MM, El-Sheemy MA. 2014. The pattern of Middle East respiratory syndrome coronavirus in Saudi Arabia: a descriptive epidemiological analysis of data from the Saudi Ministry of Health. Int J Gen Med 7:417. - PMC - PubMed
    1. Alkhouli M, Nanjundappa A, Annie F, Bates MC, Bhatt DL. 2020. Sex Differences in Case Fatality Rate of COVID-19: Insights From a Multinational Registry. Mayo Clin Proc 95:1613–1620. - PMC - PubMed
    1. Anegon I, Cuturi MC, Trinchieri G, Perussia B. 1988. Interaction of Fc receptor (CD16) ligands induces transcription of interleukin 2 receptor (CD25) and lymphokine genes and expression of their products in human natural killer cells. J Exp Med 167:452–472. - PMC - PubMed
    1. Ardain A, Domingo-Gonzalez R, Das S, Kazer SW, Howard NC, Singh A, Ahmed M, Nhamoyebonde S, Rangel-Moreno J, Ogongo P, Lu L, Ramsuran D, de la Luz Garcia-Hernandez M, K. Ulland T, Darby M, Park E, Karim F, Melocchi L, Madansein R, Dullabh KJ, Dunlap M, Marin-Agudelo N, Ebihara T, Ndung’u T, Kaushal D, Pym AS, Kolls JK, Steyn A, Zúñiga J, Horsnell W, Yokoyama WM, Shalek AK, Kløverpris HN, Colonna M, Leslie A, Khader SA. 2019. Group 3 innate lymphoid cells mediate early protective immunity against tuberculosis. Nature 570:528–532. - PMC - PubMed
    1. Arpaia N, Green JA, Moltedo B, Arvey A, Hemmers S, Yuan S, Treuting PM, Rudensky AY. 2015. A Distinct Function of Regulatory T Cells in Tissue Protection. Cell 162:1078–1089. - PMC - PubMed

Publication types

LinkOut - more resources