. 2021 Feb 22;49(3):1749-1768.
doi: 10.1093/nar/gkaa1285.

The solution structures of higher-order human telomere G-quadruplex multimers

Affiliations

The solution structures of higher-order human telomere G-quadruplex multimers

Robert C Monsen et al. Nucleic Acids Res. .

Abstract

Human telomeres contain the repeat DNA sequence 5'-d(TTAGGG), with duplex regions that are several kilobases long terminating in a 3' single-stranded overhang. The structure of the single-stranded overhang is not known with certainty, with disparate models proposed in the literature. We report here the results of an integrated structural biology approach that combines small-angle X-ray scattering, circular dichroism (CD), analytical ultracentrifugation, size-exclusion column chromatography and molecular dynamics simulations that provide the most detailed characterization to date of the structure of the telomeric overhang. We find that the single-stranded sequences 5'-d(TTAGGG)n, with n = 8, 12 and 16, fold into multimeric structures containing the maximal number (2, 3 and 4, respectively) of contiguous G4 units with no long gaps between units. The G4 units are a mixture of hybrid-1 and hybrid-2 conformers. In the multimeric structures, G4 units interact, at least transiently, at the interfaces between units to produce distinctive CD signatures. Global fitting of our hydrodynamic and scattering data to a worm-like chain (WLC) model indicates that these multimeric G4 structures are semi-flexible, with a persistence length of ∼34 Å. Investigations of its flexibility using MD simulations reveal stacking, unstacking, and coiling movements, which yield unique sites for drug targeting.


Figures

Figure 1.
Figure 1.
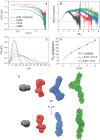
SEC-SAXS analysis of 2JSL (gray), Tel48 (red), Tel72 (blue) and Tel96 (green). (A) Log–log plot of the scattering intensity versus scattering vector, q. (B) Dimensionless Kratky plots of data in A. (C) Pair distribution function plots of data in A normalized to I(0). (D) Scatter plot of the radii of gyration from each sequence as a function of G-quadruplex motif fit to a swollen Gaussian chain polymer model (see Materials and Methods) with (inset) derived persistence length (Lp) and Flory coefficient (v). (E) DAMMIN and DAMMIF ab initio space-filling models from the data in C.
Figure 2.
Figure 2.
Results of Tel48 SAXS atomistic modeling efforts. (AB) scatter plots of calculated radii of gyration and sedimentation coefficients for hybrid-12 (A) and hybrid-21 (B) with MD-derived values shown in light gray and aMD-derived values in dark gray. The inset dashed red and blue lines represent the experimentally measured values for sedimentation coefficient and radius of gyration, respectively. The outer histograms represent the distributions of values from both MD and aMD snapshots combined. The cyan dot represents the single best-fit model (hybrid-21) as determined by CRYSOL (top left model in D). Magenta dots represent the six conformers in the best fit ensemble (all six models in D). (C) Experimental SAXS scattering data with fits from single (cyan) or ensemble (magenta) calculated scattering overlaid with χ2 values inset. (D) Single best fit model (hybrid-21, top left model) and best fit ensemble of six conformers (top row hybrid-21, bottom row hybrid-12). Models are oriented with their 5′ ends at the top.
Figure 3.
Figure 3.
Results of Tel72 SAXS atomistic modeling efforts. (A) scatter plot of calculated radii of gyration and sedimentation coefficients for the hybrid-212 model from 100 ns of standard MD simulation. The inset dashed red and blue lines represent the experimentally measured values for sedimentation coefficient and radius of gyration, respectively. The outer histograms represent the distributions of values. The cyan dot represents the single best-fit model as determined by CRYSOL. Magenta dots represent the four conformers in the best fit ensemble. (B) Experimental SAXS scattering data with fits from single (cyan) or ensemble (magenta) calculated scattering overlaid with χ2 values inset. (C) Conformations of the three hybrid-212 configurations (not showing the hybrid-221) from the best fit ensemble as determined by EOM. Models are oriented with their 5′ ends at the top.
Figure 4.
Figure 4.
Telomere G4 ensembles from EOM GAJOE analysis docked into ab initio space-filling reconstructions from DAMMIN/DAMMIF. (A) Tel48 hybrid-21 conformers, (B) 2JSL with single best-fit NMR-derived model, (C) Tel72 hybrid-212 conformers (the same as in Figure 3C), (D) Tel96 hybrid-2122 models (the same as in Supplementary Figure S5).
Figure 5.
Figure 5.
Results of MD clustering analysis of the Tel72 hybrid-212. (A) Top three representative centroids of DBSCAN clusters accounting for ∼47% of frames across the entire 100 ns trajectory. (B) space-fill electrostatic APBS map of the first model from A with dashed lines indicating the approximate sizes of each groove created at the two stacking interfaces.
Figure 6.
Figure 6.
Normalized circular dichroism spectra of Tel48 mutants and theoretical monomer G4 spectra. (A) CD spectra comparison of the WT Tel48 G-quadruplex (black) with constructs created to favor the hybrid-1 form in the second (red), first and second (blue), or first position (green). (B) Comparison of the Tel48 CD spectrum with theoretical monomer CD combinations of hybrid-22 (red dashed), hybrid-12 with a 30/70 weighting (blue dashed), and a hybrid-11 (purple dashed). Component monomer spectra used for theoretical spectra in B were derived from sequences of the monomer telomere G-quadruplexes PDB IDs 2GKU (hybrid-1) and 2JSL (hybrid-2) annealed in potassium buffer.
Figure 7.
Figure 7.
Circular dichroism analysis of the higher-order telomere G-quadruplexes. (A) Pre- and post-corrected (‘Corr’) CD spectra of the Tel48, Tel72 and Tel96 sequences by subtraction of the ‘junctional’ spectrum in B. (B) The average (dark blue line) and range (light blue space fill) of ‘junctional’ CD spectra derived from deconstruction of the Tel48 sequences in Figure 6 and Supplementary Figure S6 using constituent monomer spectra. (C) Regression analysis of the uncorrected and corrected Δϵ290nm values as a function of the number of G4 motifs. (D–F) Corrected CD spectra of the Tel48, Tel72 and Tel96 sequences with overlaid theoretical spectra derived from the linear addition of monomer spectra. Each ‘12’ or ‘121’ correspond to different combinations of telomere sequences which form either hybrid-1 or hybrid-2 (see Supplementary Figure S7). The red spectrum in each plot is the best fit as judged by RSS analysis. Residuals are shown below each figure. See Supplementary Figure S7 for the full RSS analysis along with the PDB identifiers of sequences used to compute theoretical spectra.
Figure 8.
Figure 8.
DNA force of bending plot for single-stranded (green), double-stranded (red) and G4 telomere DNA (black). Force curve calculations were performed similar to reference (79) using literature values of persistence length for ssDNA (Lp = 22 Å), dsDNA (Lp = 550 Å), and Telomere G4 (Lp = 34.8 Å) as measured here. The Y-axis is the estimated force (in pN) to bend a length of DNA (X-axis) 180° about the arc of a semi-circle (i.e. if you have a 330 Å long single-stranded DNA it will require a force of ∼0.05 pN to bend it into a semi-circle). Dashed horizontal lines are visual references to common biological forces found in the cell (orange indicates the approximate range of force from thermal fluctuations). The light blue region highlights the range in which short telomere G4s would be found, indicating that a large force would be required to bend short telomeres (≤96 nt). The dashed red arrow illustrates that if a ∼200 Å long ssDNA telomere (approximately 63 nt) were to spontaneously fold into a contiguous G4 structure, the resulting bending force required for a 180° turn increases by an order of magnitude. The increase in bending force is comparable to the same length of DNA in duplex form (330 Å long duplex requires external forces equivalent to ATP hydrolysis to bend 180°). In the case of duplex DNA, the energy requirement of ‘tight’ bending is usually compensated for by the highly positive charge on histones.

References

    1. de Lange T. Shelterin: the protein complex that shapes and safeguards human telomeres. Genes Dev. 2005; 19:2100–2110. - PubMed
    1. Stewart J.A., Chaiken M.F., Wang F., Price C.M.. Maintaining the end: roles of telomere proteins in end-protection, telomere replication and length regulation. Mutat. Res. 2012; 730:12–19. - PMC - PubMed
    1. Wright W.E., Tesmer V.M., Huffman K.E., Levene S.D., Shay J.W.. Normal human chromosomes have long G-rich telomeric overhangs at one end. Genes Dev. 1997; 11:2801–2809. - PMC - PubMed
    1. Neidle S., Parkinson G.. Telomere maintenance as a target for anticancer drug discovery. Nat. Rev. Drug Discov. 2002; 1:383–393. - PubMed
    1. Townsley D.M., Dumitriu B., Young N.S.. Bone marrow failure and the telomeropathies. Blood. 2014; 124:2775–2783. - PMC - PubMed

Publication types