. 2021 Feb 23;15(2):3212-3227.
doi: 10.1021/acsnano.0c09873. Epub 2021 Jan 20.

Selection of Fluorescent, Bioluminescent, and Radioactive Tracers to Accurately Reflect Extracellular Vesicle Biodistribution in Vivo

Affiliations

Selection of Fluorescent, Bioluminescent, and Radioactive Tracers to Accurately Reflect Extracellular Vesicle Biodistribution in Vivo

Elisa Lázaro-Ibáñez et al. ACS Nano. .

Abstract

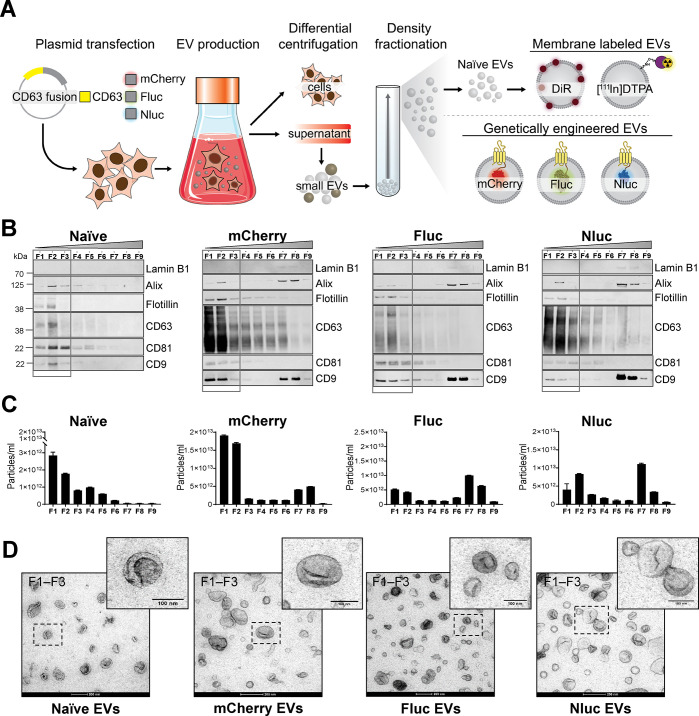
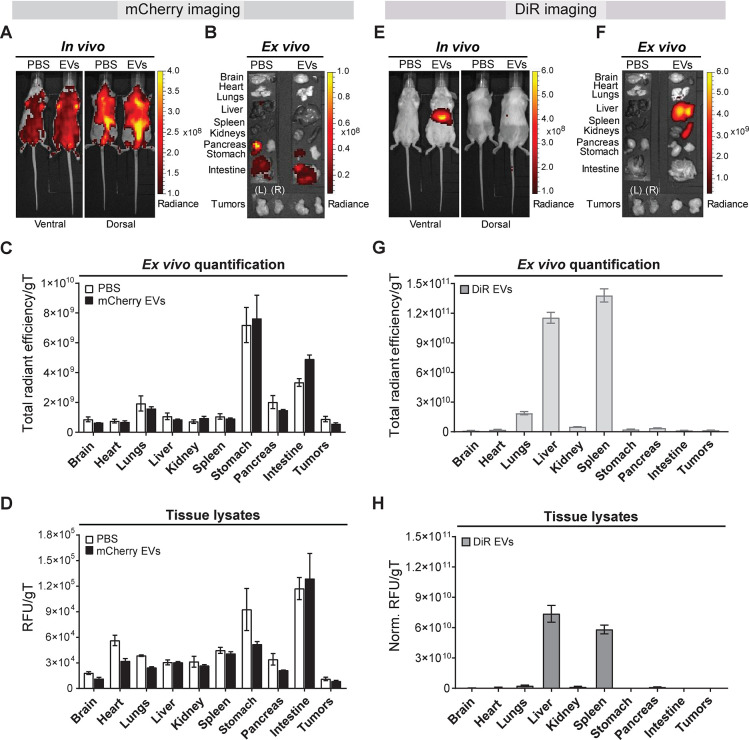
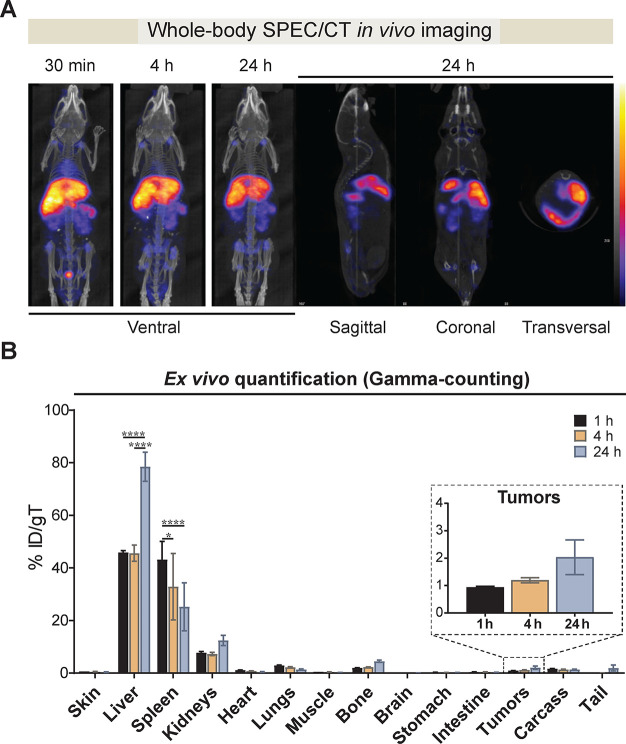
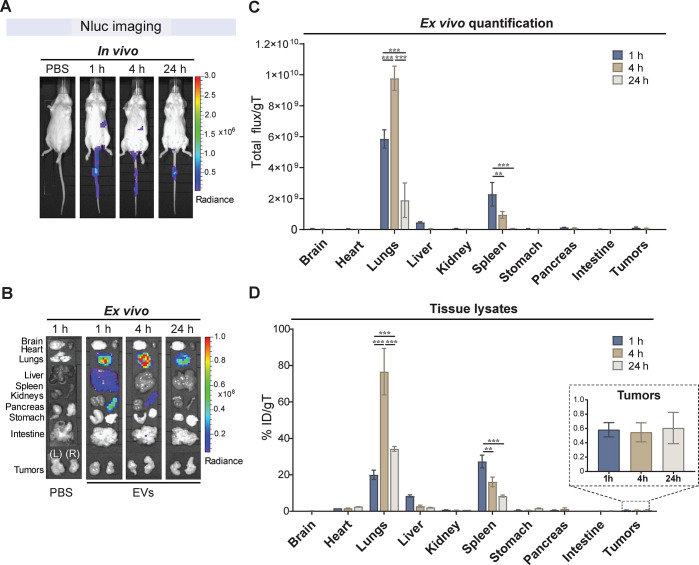
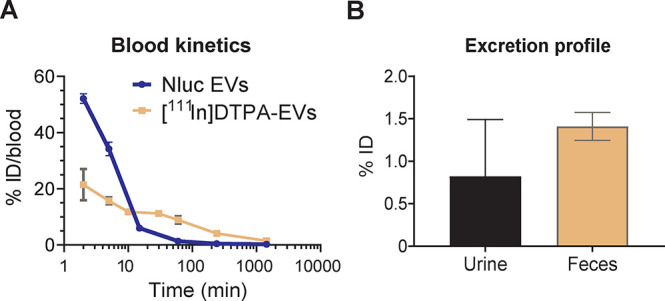
The ability to track extracellular vesicles (EVs) in vivo without influencing their biodistribution is a key requirement for their successful development as drug delivery vehicles and therapeutic agents. Here, we evaluated the effect of five different optical and nuclear tracers on the in vivo biodistribution of EVs. Expi293F EVs were labeled using either a noncovalent fluorescent dye DiR, or covalent modification with 111indium-DTPA, or bioengineered with fluorescent (mCherry) or bioluminescent (Firefly and NanoLuc luciferase) proteins fused to the EV marker, CD63. To focus specifically on the effect of the tracer, we compared EVs derived from the same cell source and administered systemically by the same route and at equal dose into tumor-bearing BALB/c mice. 111Indium and DiR were the most sensitive tracers for in vivo imaging of EVs, providing the most accurate quantification of vesicle biodistribution by ex vivo imaging of organs and analysis of tissue lysates. Specifically, NanoLuc fused to CD63 altered EV distribution, resulting in high accumulation in the lungs, demonstrating that genetic modification of EVs for tracking purposes may compromise their physiological biodistribution. Blood kinetic analysis revealed that EVs are rapidly cleared from the circulation with a half-life below 10 min. Our study demonstrates that radioactivity is the most accurate EV tracking approach for a complete quantitative biodistribution study including pharmacokinetic profiling. In conclusion, we provide a comprehensive comparison of fluorescent, bioluminescent, and radioactivity approaches, including dual labeling of EVs, to enable accurate spatiotemporal resolution of EV trafficking in mice, an essential step in developing EV therapeutics.

Keywords: biodistribution; delivery; exosomes; extracellular vesicles; nuclear imaging; optical imaging; vesicle tracers.


Conflict of interest statement

The authors declare the following competing financial interest(s): E.L.-I., A.M.S., A.F.S., and N.D. are currently employed and hold equity in AstraZeneca R&D.

Figures

Figure 1
Figure 1
Generation and characterization of membrane-labeled and engineered EVs. (A) Schematic illustrations representing the EV production process. Expi293F cells were either used unmodified to produce naïve EVs or were transiently transfected with plasmids coding for mCherry, Firefly luciferase (Fluc), and NanoLuc luciferase (Nluc) fused to the C-terminal of human CD63. Cell supernatant from naïve or engineered cells was collected 48 h post-transfection and subjected to differential centrifugation for the isolation of small EVs (also called exosomes). Small EVs (100,000g pellets) were subsequently bottom-loaded in high-resolution iodixanol density gradients (Optiprep) with decreasing densities (50–10%, bottom to top). Nine fractions of 1 or 2 mL each were collected from top to bottom and analyzed. Naïve EVs were membrane-labeled with XenoLight DiR (lipophilic dye) or 111indium [111In]-DTPA (chemical labeling) or genetically modified to carry mCherry, Fluc, or Nluc proteins. PDB ID codes (2H5Q, 1LCI, and 5IBO) were used for illustrations of the protein structures. (B) Western blot analysis of the density fractions (F1–F9) (12 μL/each). Membranes were blotted with the following antibodies: Lamin B1, Alix, Flotillin, CD63, CD81, CD9. Low-density fractions (F1–F3) are represented with a box. (C) Representative nanoparticle tracking analysis graphs of EV concentration as the total number of particles per milliliter in each fraction (F1–F9). Bars represent the mean ± standard error of mean. (D) Representative negative staining transmission electron microscopy and zoomed-in images of low-density EVs (F1–F3). Five microliters was loaded to the grids. Scale bars are 200 nm in the wide-field images and 100 nm in the magnifications.
Figure 2
Figure 2
In vivo tracking of mCherry- and XenoLight DiR-labeled Expi293F EVs in mice. CT26 tumor-bearing BALB/c mice were intravenously injected with 1011 mCherry EVs or DiR-labeled EVs or PBS via the tail vein. In vivo and ex vivo imaging analyses and tissue quantifications were performed at 24 h postadministration. (A) Representative in vivo ventral and dorsal images of PBS-treated or mCherry EV-treated mice. (B) Following in vivo imaging of PBS-treated or mCherry EV-treated mice, whole major organs (brain, heart, lungs, liver, spleen, kidneys, pancreas, stomach, intestine, and tumors) were excised and imaged ex vivo. Representative ex vivo images are shown. Organs are annotated on the left side of the panel. Tumors: right (R), left (L). (C) Semiquantitative analysis of the ex vivo imaging data of organs from PBS-treated (white) and EV-treated (black) animals. Data were analyzed using the Living Image 4.7.2 software. Individual regions of interest (ROIs) were drawn for each organ to obtain their respective fluorescence signals. Fluorescent signal is represented as total radiant efficiency [p/s]/[μW/cm2] per grams of tissue (gT); n = 3 for all groups. (D) Quantitative organ biodistribution profile from tissue lysates of mice treated with PBS or mCherry EVs. Organs were homogenized using a lysis buffer and cleared of tissue debris before mCherry fluorescence detection using the IVIS Lumina III system. Relative fluorescence signals (RFU) are expressed per gT. All values are represented as mean ± standard error of mean; n = 3 for all groups. (E) Representative real-time in vivo ventral and dorsal images of mice treated with DiR-labeled EVs or PBS. (F) Major organs were excised and imaged ex vivo. Representative ex vivo images of whole organs are shown. Organs are annotated on the left side of the panel. Tumors: right (R), left (L). (G) Semiquantitative analysis of the organ biodistribution profile from ex vivo imaging of DiR EV-treated mice. Individual ROIs were drawn for each organ to obtain their respective DiR fluorescence signals. Background signals from the PBS-treated mice were subtracted from the data. Fluorescent signal is represented as total radiant efficiency [p/s]/[μW/cm2] per gT. Data were analyzed using the Living Image 4.7.2 software. Values are expressed as mean ± standard error of mean; n = 3 for all groups. (H) Quantitative organ biodistribution profile from tissue lysates of mice treated with DiR-labeled EVs. Organs were homogenized and analyzed as described above. RFU signals are expressed per gT after background tissue subtraction of PBS-treated animals. Values are expressed as mean ± standard error of mean; n = 3 for all groups.
Figure 3
Figure 3
In vivo tracking of radiolabeled 111indium-DTPA Expi293F EVs. Membrane-radiolabeled 111indium [111In]-DTPA Expi293F EVs were intravenously administered into subcutaneous CT26 tumor-bearing BALB/c mice at a dose of 1011 vesicles per animal. Mice were imaged by single-photon emission computed tomography (SPECT) coupled with computed tomography (CT) for anatomical information. (A) Whole-body SPECT/CT live imaging of [111In]-DTPA EVs. Representative whole-body ventral view images of all time points are shown. Imaging was performed at 30 min, 4 h, and 24 h post-EV injection. Representative images of sagittal, coronal, and transverse views of EV-treated animals at 24 h are shown. Scale bar represents low (black) to high (yellow) signals. (B) Ex vivo quantification of organ biodistribution of [111In]-DTPA EVs by gamma counting. Animals were culled at 1 h, 4 and 24 h post-EV injection, perfused with saline, and whole organs were excised for quantitative analysis. Inset shows the tumor accumulation values over time. Values were normalized to the grams of tissue and expressed as mean ± standard error of mean, where n = 3 for each group. Two-way ANOVA with Tukey’ multiple comparison test;****p value <0.0001, *p value <0.05.
Figure 4
Figure 4
In vivo tracking of NanoLuc Expi293F EVs. Engineered CD63-NanoLuc (Nluc) Expi293F EVs were intravenously administered into subcutaneous CT26 tumor-bearing BALB/c mice at a dose of 1011 vesicles per mice via the tail vein. (A) Representative real-time in vivo live imaging of Nluc EVs. The substrate furimazine was injected intravenously at 1, 4, and 24 h post-EV administration, and the mice were imaged within 2 min of substrate administration. (B) Following in vivo imaging, animals were sacrificed, perfused with saline, and major organs (brain, heart, lungs, liver, spleen, kidneys, pancreas, stomach, intestine, and tumors) were excised, immersed in furimazine for 30 s, blotted on tissue paper, and imaged within 2 min. A representative panel of ex vivo imaging of organs is shown. Organs are annotated on the left side of the panel. (C) Semiquantitative analysis of Nluc EVs from ex vivo images of whole organs analyzed using the Living Image 4.7.2 software. Values are normalized to organ weight as total flux per gram of tissue (gT). (D) Quantitative analysis of Nluc EV signals from tissue lysates. Organs were homogenized and cleared of tissue debris before bioluminescence quantification as above. Values are normalized to organ weight and expressed as the percentage of injected dose (ID) per gT. Inset shows the tumor accumulation values of Nluc EVs. For all graphs, values are expressed as mean ± standard error of mean, where n = 3 for each group. Two-way ANOVA with Tukey’s multiple comparison test; ***p value <0.001, **p value <0.001.
Figure 5
Figure 5
Blood clearance and excretion profile of NanoLuc and [111In]-DTPA Expi293F EVs. (A) Evaluation of the blood kinetics of EVs as a percentage of injected dose (ID) in blood over time. Blood (50 μL) from NanoLuc (Nluc) EV-treated animals was collected via tail bleeding at 2 min, 5 min, 15 min, 1 h, 4 h, and 24 h and left to clot to obtain the serum for bioluminescence quantification on a FLUOstar Omega plate reader. Blood (5 μL) from [111In]-DTPA EV-treated mice was taken via tail bleeding at 2 min, 5 min, 10 min, 30 min, 1 h, 4 h, and 24 h. Samples were analyzed for [111In]-specific activity using an automated gamma counter. (B) Excretion profile of [111In]-DTPA EVs in urine and feces collected from the animals 24 h postinjection. For all graphs, values are expressed as mean ± standard error of mean, where n = 3 for each group.

References

    1. Théry C.; Zitvogel L.; Amigorena S. Exosomes: Composition, Biogenesis and Function. Nat. Rev. Immunol. 2002, 2 (8), 569–579. 10.1038/nri855. - DOI - PubMed
    1. Yanez-Mo M.; Siljander P. R.-M.; Andreu Z.; Bedina Zavec A.; Borras F. E.; Buzas E. I.; Buzas K.; Casal E.; Cappello F.; Carvalho J.; Colas E.; Cordeiro-da Silva A.; Fais S.; Falcon-Perez J. M.; Ghobrial I. M.; Giebel B.; Gimona M.; Graner M.; Gursel I.; Gursel M.; Heegaard N. H. H.; Hendrix A.; Kierulf P.; Kokubun K.; Kosanovic M.; Kralj-Iglic V.; Kramer-Albers E.-M.; Laitinen S.; Lasser C.; Lener T.; Ligeti E.; Line A.; Lipps G.; Llorente A.; Lotvall J.; Mancek-Keber M.; Marcilla A.; Mittelbrunn M.; Nazarenko I.; Nolte-‘t Hoen E. N.M.; Nyman T. A.; O'Driscoll L.; Olivan M.; Oliveira C.; Pallinger E.; del Portillo H. A.; Reventos J.; Rigau M.; Rohde E.; Sammar M.; Sanchez-Madrid F.; Santarem N.; Schallmoser K.; Stampe Ostenfeld M.; Stoorvogel W.; Stukelj R.; Van der Grein S. G.; Helena Vasconcelos M.; Wauben M. H. M.; De Wever O. Biological Properties of Extracellular Vesicles and Their Physiological Functions. J. Extracell. Vesicles 2015, 4 (1), 27066.10.3402/jev.v4.27066. - DOI - PMC - PubMed
    1. Raposo G.; Stoorvogel W. Extracellular Vesicles: Exosomes, Microvesicles, and Friends. J. Cell Biol. 2013, 200 (4), 373–383. 10.1083/jcb.201211138. - DOI - PMC - PubMed
    1. Saleh A. F.; Lazaro-Ibanez E.; Forsgard M. A.-M.; Shatnyeva O.; Osteikoetxea X.; Karlsson F.; Heath N.; Ingelsten M.; Rose J.; Harris J.; Mairesse M.; Bates S. M.; Clausen M.; Etal D.; Leonard E.; Fellows M. D.; Dekker N.; Edmunds N. Extracellular Vesicles Induce Minimal Hepatotoxicity and Immunogenicity. Nanoscale 2019, 11 (14), 6990–7001. 10.1039/C8NR08720B. - DOI - PubMed
    1. Zhu X.; Badawi M.; Pomeroy S.; Sutaria D. S.; Xie Z.; Baek A.; Jiang J.; Elgamal O. A.; Mo X.; Perle K. L.; Chalmers J.; Schmittgen T. D.; Phelps M. A. Comprehensive Toxicity and Immunogenicity Studies Reveal Minimal Effects in Mice Following Sustained Dosing of Extracellular Vesicles Derived from HEK293T Cells. J. Extracell. Vesicles 2017, 6 (1), 1324730.10.1080/20013078.2017.1324730. - DOI - PMC - PubMed

Publication types

Substances

LinkOut - more resources