. 2021 Jun;11(5):333-348.
doi: 10.1089/brain.2020.0881. Epub 2021 Mar 3.

Geodesic Distance on Optimally Regularized Functional Connectomes Uncovers Individual Fingerprints

Affiliations

Geodesic Distance on Optimally Regularized Functional Connectomes Uncovers Individual Fingerprints

Kausar Abbas et al. Brain Connect. 2021 Jun.

Abstract

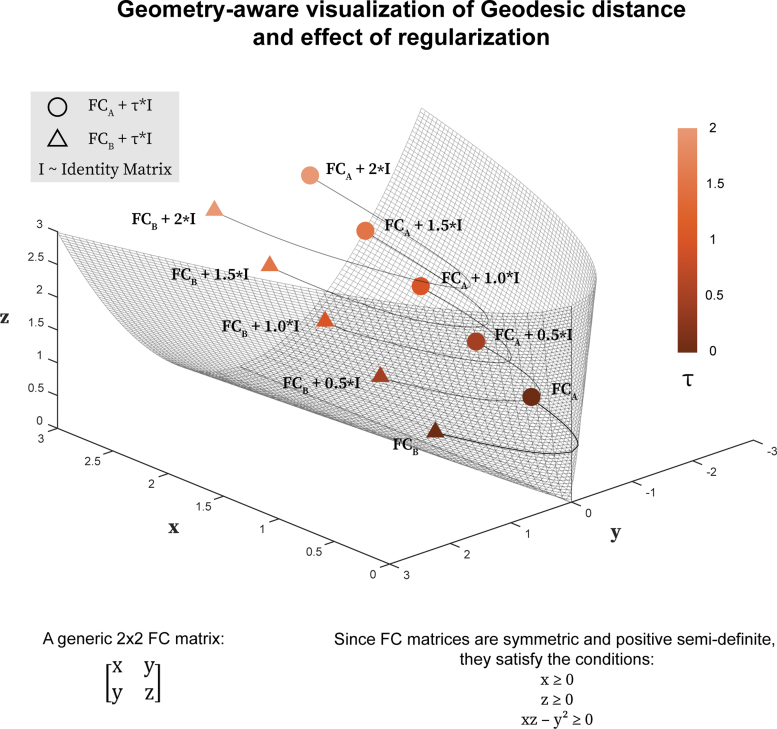
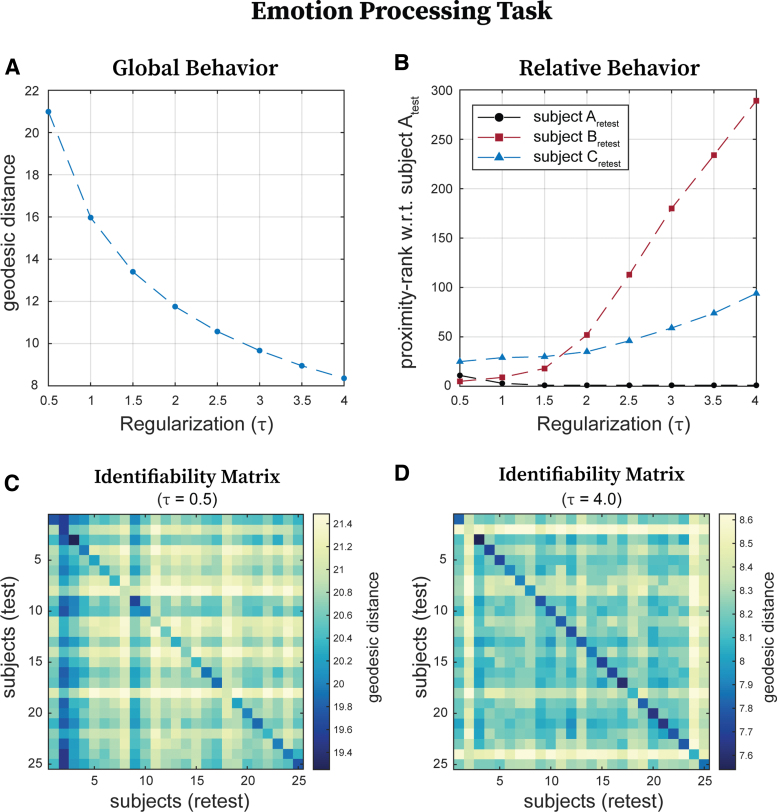
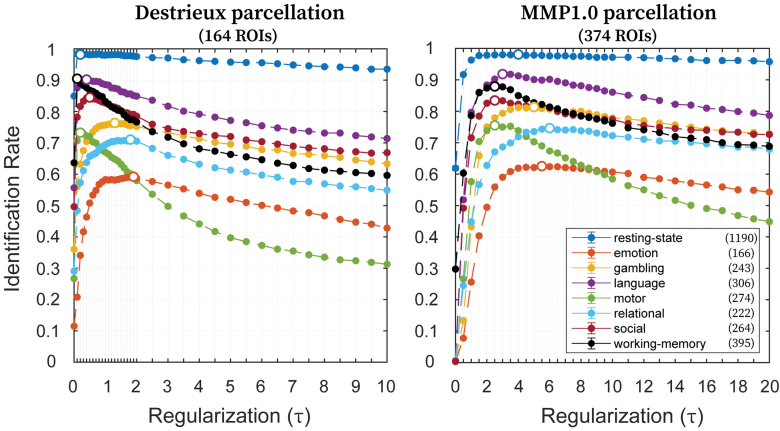
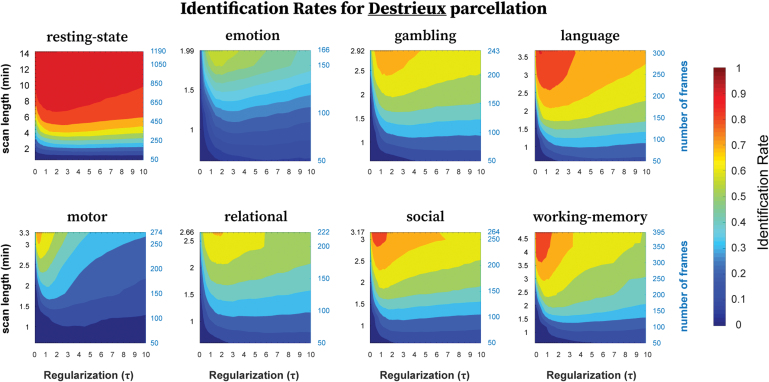
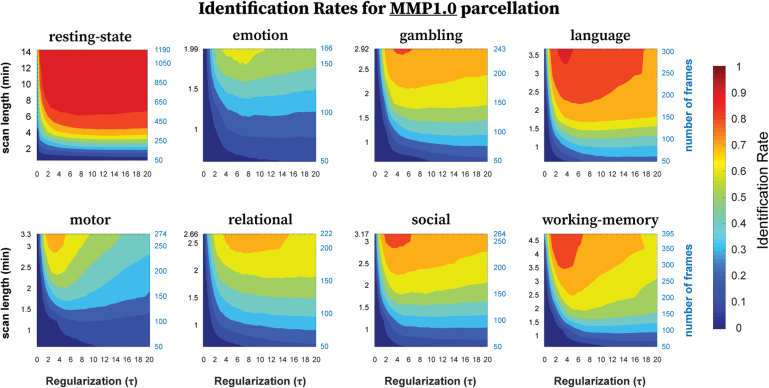
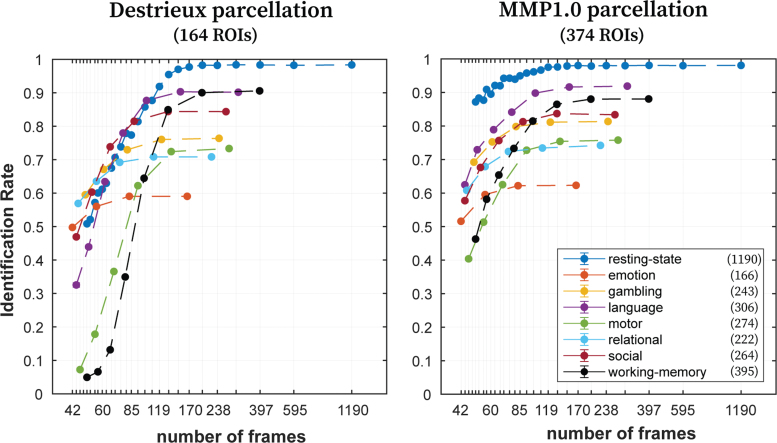
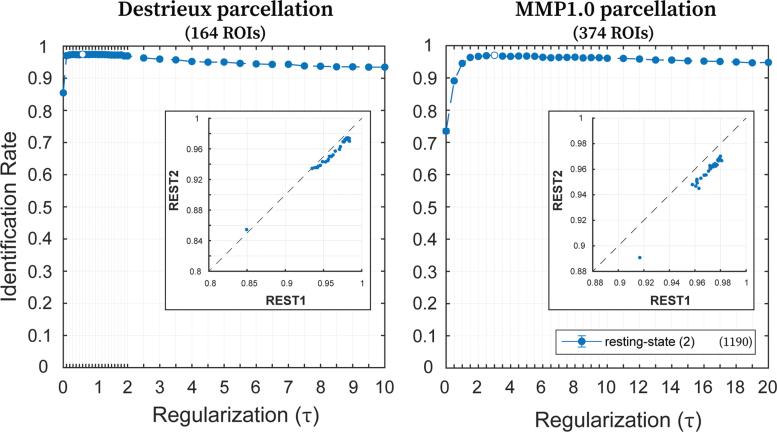
Background: Functional connectomes (FCs) have been shown to provide a reproducible individual fingerprint, which has opened the possibility of personalized medicine for neuro/psychiatric disorders. Thus, developing accurate ways to compare FCs is essential to establish associations with behavior and/or cognition at the individual level. Methods: Canonically, FCs are compared using Pearson's correlation coefficient of the entire functional connectivity profiles. Recently, it has been proposed that the use of geodesic distance is a more accurate way of comparing FCs, one which reflects the underlying non-Euclidean geometry of the data. Computing geodesic distance requires FCs to be positive-definite and hence invertible matrices. As this requirement depends on the functional magnetic resonance imaging scanning length and the parcellation used, it is not always attainable and sometimes a regularization procedure is required. Results: In the present work, we show that regularization is not only an algebraic operation for making FCs invertible, but also that an optimal magnitude of regularization leads to systematically higher fingerprints. We also show evidence that optimal regularization is data set-dependent and varies as a function of condition, parcellation, scanning length, and the number of frames used to compute the FCs. Discussion: We demonstrate that a universally fixed regularization does not fully uncover the potential of geodesic distance on individual fingerprinting and indeed could severely diminish it. Thus, an optimal regularization must be estimated on each data set to uncover the most differentiable across-subject and reproducible within-subject geodesic distances between FCs. The resulting pairwise geodesic distances at the optimal regularization level constitute a very reliable quantification of differences between subjects.

Keywords: FC fingerprinting; brain connectomics; geodesic distance; individual fingerprint; regularization.


Conflict of interest statement

No competing financial interests exist.

Figures

FIG. 1.
FIG. 1.
Incremental regularization of FCs and its effect on the estimates of geodesic distance. We illustrate the geodesic distance between two FCs of size 2×2 (denoted here by a circle and a triangle) and how it changes with increasing regularization (τ) of FCs. All the positive-definite (full rank) FCs comprise the cone interior, whereas all the rank-deficient positive semidefinite FCs (having at least one 0 eigenvalue) reside on the cone boundary. Different magnitudes of τ reallocate FCs within the positive semidefinite cone. We should also highlight that for FCs of higher dimensions, a three-dimensional visualization of the positive semidefinite cone is not possible. FCs, functional connectomes. Color images are available online.
FIG. 2.
FIG. 2.
Effect of regularization (τ) on global and relative geodesic distances. We have chosen the emotion processing FCs to illustrate how geodesic distances across subjects and/or sessions change with regularization magnitude. (A) Global geodesic distance (in this case averaged geodesic distance between test and retest sessions of all subjects for the emotion processing task) decreases exponentially with increasing regularization. (B) Shows how close (in terms of proximity-rank with respect to all the other subjects) retest sessions of subjects A, B, and C are to the test session of subject A. Note that the three proximity-ranks fluctuate with regularization. (C) Identifiability matrix based on geodesic distance for low (τ=0.5) regularization for a subsample of 25 subjects performing the emotion processing task. (D) Identifiability matrix based on geodesic distance for high (τ=4) regularization for the same subsample of 25 subjects performing the emotion processing task. Color images are available online.
FIG. 3.
FIG. 3.
Effect of regularization (τ) on identification rates. Identification rates for all eight conditions (utilizing maximum available scanning length) with variable magnitudes of τ, using Destrieux (left; 164 ROIs) and MMP1.0 (right; 374 ROIs) parcellations. Filled circles indicate the mean identification rate, whereas error bars indicate the standard error of the mean across samplings with replacement (error bars are small enough that they are hidden behind the circles). Legend indicates the eight conditions along with maximum available number of frames. Along each curve, the circle not filled indicates the optimal value of τ, which maximizes the identification rate. Color images are available online.
FIG. 4.
FIG. 4.
Identification rates as a function of regularization (τ) and scanning length used to compute FCs using Destrieux parcellation. The panel shows identification rates, averaged across samplings without replacement, for all eight fMRI conditions. For any given condition, the scanning length was adjusted by selecting frames sequentially of the total time series ranging from 50 to maximum number of frames available, in steps of 50. fMRI, functional magnetic resonance imaging. Color images are available online.
FIG. 5.
FIG. 5.
Identification rates as a function of regularization (τ) and scanning length used to compute FCs using MMP1.0 parcellation. The panel shows identification rates, averaged across samplings without replacement, for all eight fMRI conditions. For any given condition, the scanning length was adjusted by selecting frames sequentially of the total time series ranging from 50 to maximum number of frames available, in steps of 50. Color images are available online.
FIG. 6.
FIG. 6.
Effect of number of frames on identification rates using the entire scanning length. Identification rates for all eight fMRI conditions (utilizing optimal regularization magnitude [τ*]—see Table 1) with variable number of frames, using Destrieux (left; 164 ROIs) and MMP1.0 (right; 374 ROIs) parcellations. Maximum scanning length was always maintained for each condition by choosing alternate points from BOLD time series. For instance, 397 frames were obtained for resting-state by choosing every third time point. Filled circles indicate the mean identification rate, whereas error bars indicate the standard error of the mean across samplings with replacement (error bars are small enough that they are hidden behind the dots). Legend indicates the eight fMRI conditions along with the maximum number of frames available. BOLD, blood oxygenation level dependent. Color images are available online.
FIG. 7.
FIG. 7.
Generalizability: effect of regularization (τ) on identification rates for REST2. Identification rates for the two sessions (LR and RL) from REST2 (utilizing maximum available scanning length) with variable magnitudes of τ, using Destrieux (left; 164 ROIs) and MMP1.0 (right; 374 ROIs) parcellations. Filled circles indicate the mean identification rate, whereas error bars indicate the standard error of the mean across samplings with replacement (error bars are small enough that they are hidden behind the circles). Legend indicates the REST2 condition along with maximum available number of frames. Along each curve, the circle not filled indicates the optimal value of τ, which maximizes the identification rate. The insets in both plots are the scatter plots between REST1 and REST2 of the mean identification rates (across samplings) for the entire range of τ. Both x- and y-axes indicate identification rates and the dotted line is identity line. LR, left to right; REST, resting-state; RL, right to left. Color images are available online.

References

    1. Abbas K, Amico E, Svaldi D, et al. 2020. GEFF: graph embedding for functional fingerprinting. Neuroimage 221:117181. - PubMed
    1. Allen EA, Damaraju E, Plis SM, et al. 2014a. Tracking whole-brain connectivity dynamics in the resting state. Cereb Cortex 24:663–676 - PMC - PubMed
    1. Allen NE, Sudlow C, Peakman T, et al. 2014b. UK biobank data: come and get it. Sci Transl Med 6: 3008601 - PubMed
    1. Amico E, Arenas A, Goñi J. 2019. Centralized and distributed cognitive task processing in the human connectome. Netw Neurosci 3:455–474 - PMC - PubMed
    1. Amico E, Goñi J. 2018. The quest for identifiability in human functional connectomes. Sci Rep 8:8254. - PMC - PubMed

Publication types

LinkOut - more resources