. 2021 Jan 20:10:e61980.
doi: 10.7554/eLife.61980.

Metabolomic profiling of rare cell populations isolated by flow cytometry from tissues

Affiliations

Metabolomic profiling of rare cell populations isolated by flow cytometry from tissues

Andrew W DeVilbiss et al. Elife. .

Abstract

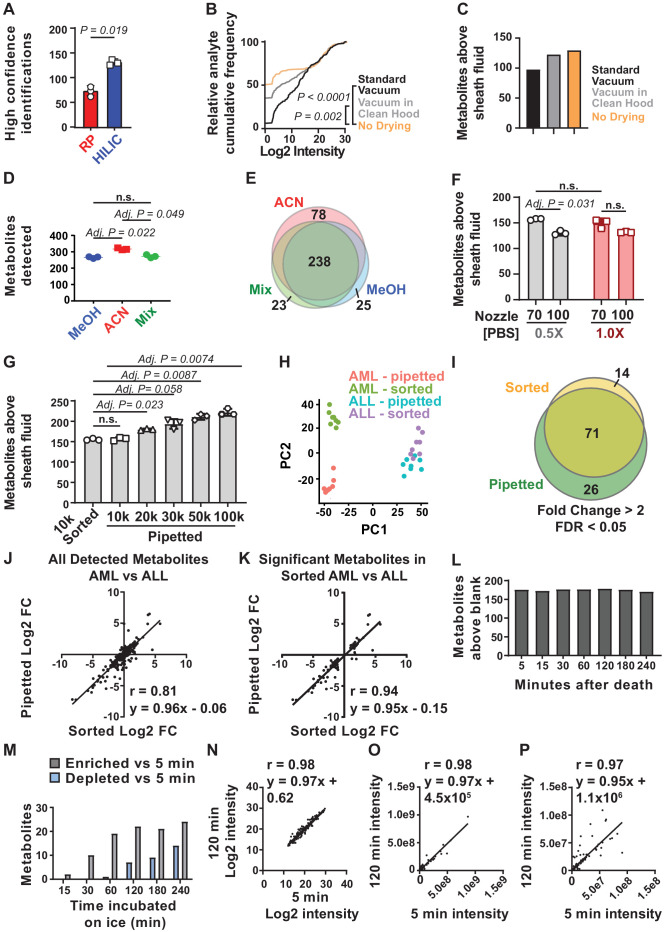
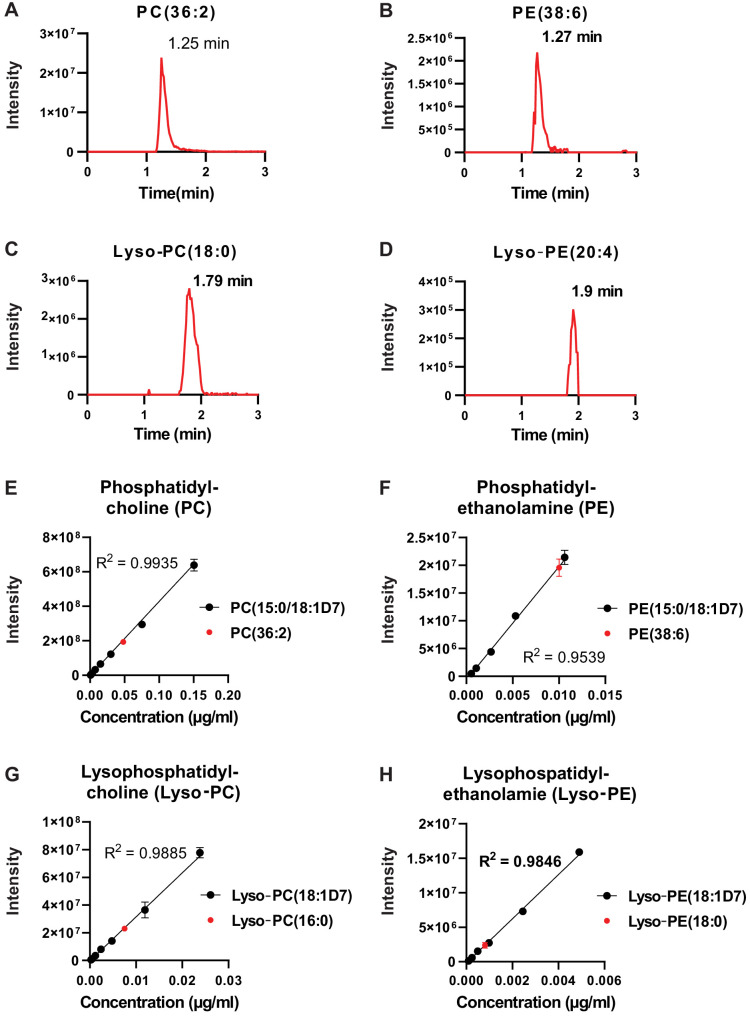
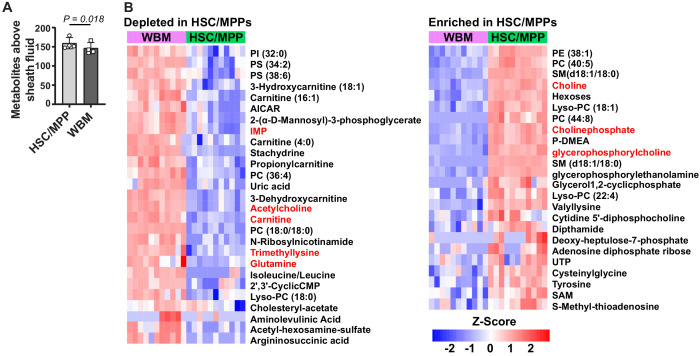
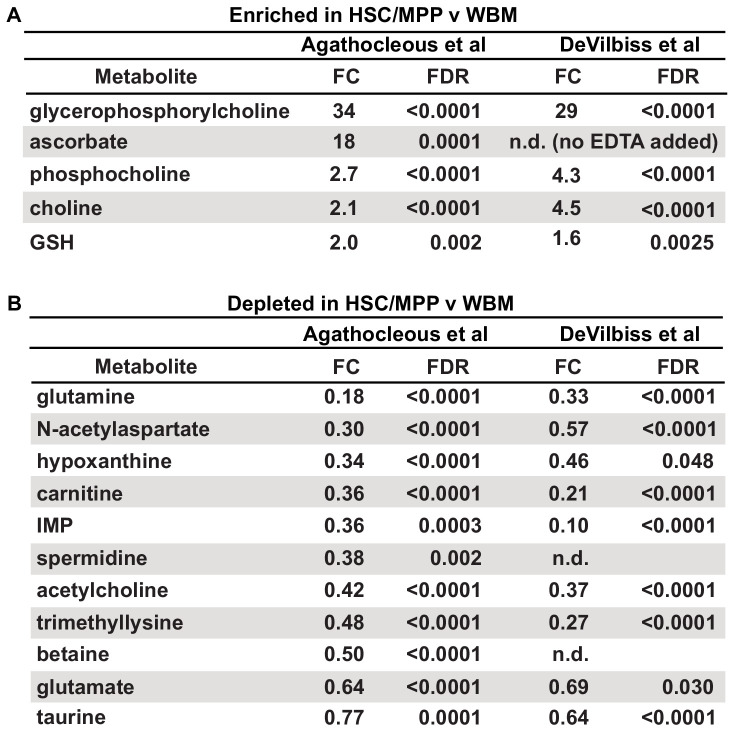
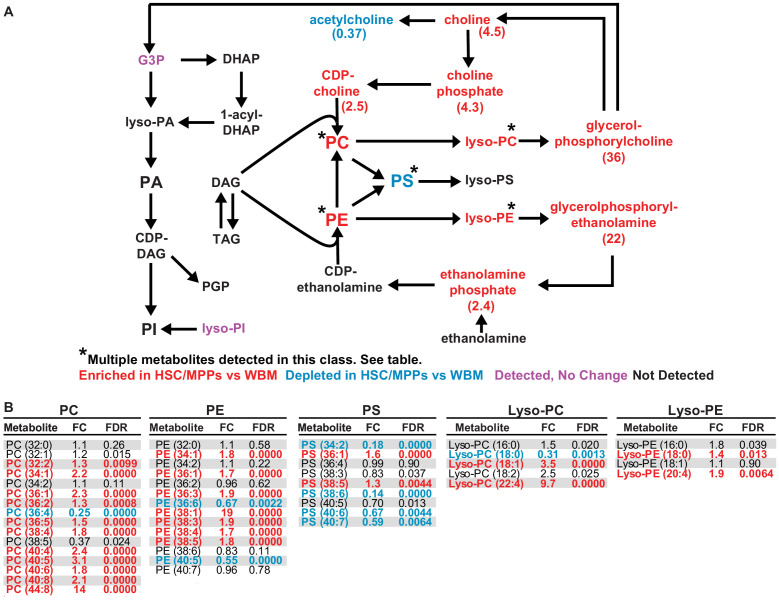
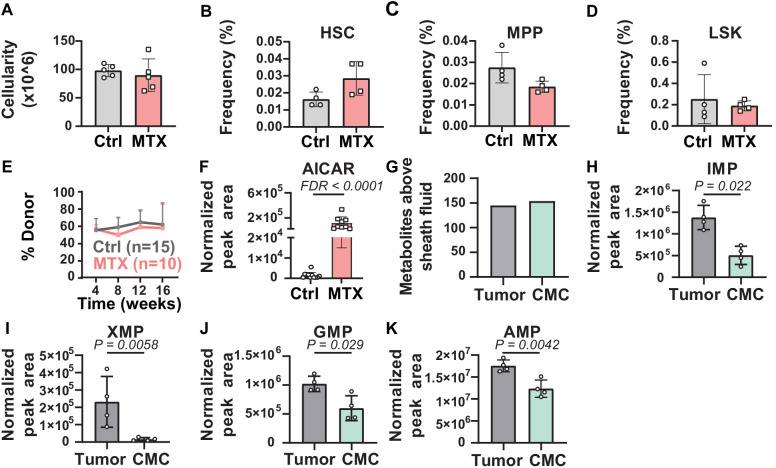
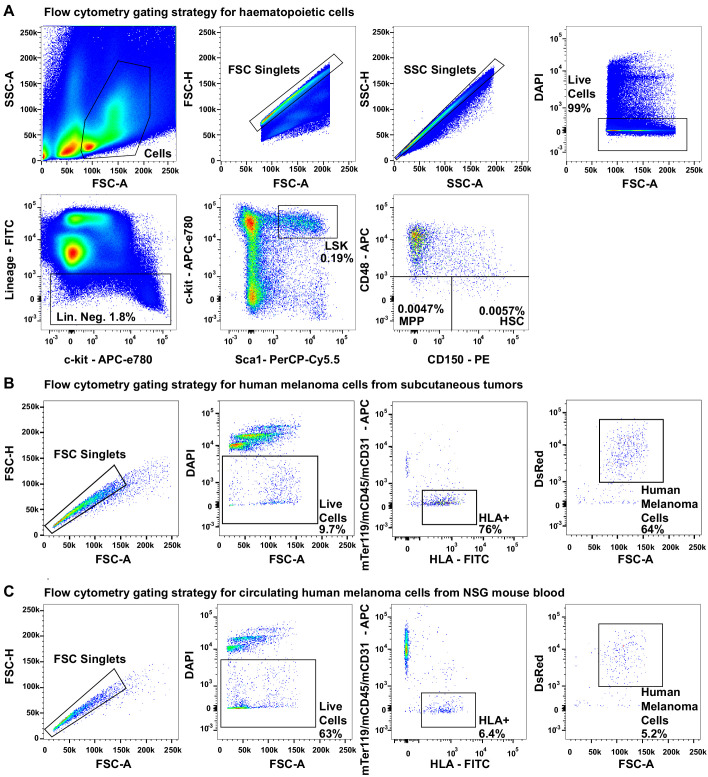
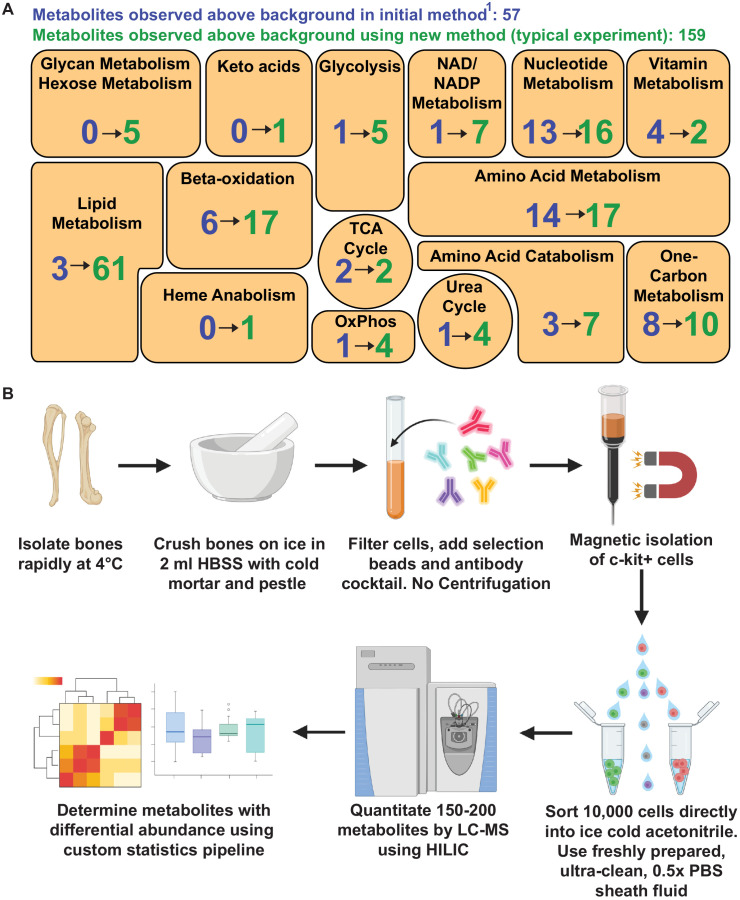
Little is known about the metabolic regulation of rare cell populations because most metabolites are hard to detect in small numbers of cells. We previously described a method for metabolomic profiling of flow cytometrically isolated hematopoietic stem cells (HSCs) that detects 60 metabolites in 10,000 cells (Agathocleous et al., 2017). Here we describe a new method involving hydrophilic liquid interaction chromatography and high-sensitivity orbitrap mass spectrometry that detected 160 metabolites in 10,000 HSCs, including many more glycolytic and lipid intermediates. We improved chromatographic separation, increased mass resolution, minimized ion suppression, and eliminated sample drying. Most metabolite levels did not significantly change during cell isolation. Mouse HSCs exhibited increased glycerophospholipids relative to bone marrow cells and methotrexate treatment altered purine biosynthesis. Circulating human melanoma cells were depleted for purine intermediates relative to subcutaneous tumors, suggesting decreased purine synthesis during metastasis. These methods facilitate the routine metabolomic analysis of rare cells from tissues.

Keywords: circulating cancer cell; hematopoietic stem cell; melanoma; metabolism; metabolomics; mouse; regenerative medicine; stem cells.


Conflict of interest statement

AD, ZZ, MM, JU, AT, MA, TM No competing interests declared, SM advisor for Frequency Therapeutics and Protein Fluidics as well as a stockholder in G1 Therapeutics.

Figures

Figure 1.
Figure 1.. Sample processing and chromatography parameters.
(A) The number of metabolites identified with high confidence spectral database matching in whole bone marrow (WBM) samples after HILIC or reverse phase chromatography (n = 3 replicates per group from one experiment). (B) Average peak intensities in sheath fluid background samples after drying with a standard vacuum concentrator, a vacuum concentrator in a positive pressure HEPA-filtered clean hood, or with no drying (n = 5 replicates per treatment from one experiment). (C) Number of metabolites significantly above sheath fluid background in 10,000 sorted WBM cells after drying with a standard vacuum concentrator, a vacuum concentrator in a clean hood, or with no drying (n = 5 replicates per treatment from one experiment). The threshold for statistical significance relative to background or other samples was always set at fold change >2 and false discovery rate (FDR) < 0.05, unless otherwise indicated. (D) Metabolites detected in 100,000 WBM cells extracted with 80% acetonitrile in water (ACN), 80% methanol in water (MeOH), or 40% ACN plus 40% MeOH in water (Mix) (n = 3 replicates per treatment from one experiment). (E) Overlap in metabolites detected with each extraction solvent (n = 3 replicates per treatment from one experiment). (F) Number of metabolites significantly above background in 10,000 WBM cells sorted using a 70 or 100 μm nozzle, and 0.5× or 1.0× phosphate buffered saline (PBS) sheath fluid (n = 5 replicates per treatment in each of three independent experiments; the metabolites that significantly differed between 0.5× PBS versus 1× PBS sheath fluid are listed in Figure 1—source data 2, Supplementary Table 1). (G) Number of metabolites significantly above background in 10,000 sorted WBM cells or 10,000–100,000 pipetted WBM cells (n = 5 replicates per treatment in each of three independent experiments). (H–K): (H) Principal component analysis of 10,000 sorted or pipetted HNT-34 AML (AML) cells or DND-41 T-ALL (ALL) cells (one experiment with n = 8 replicates per treatment; the metabolites that significantly differed between sorted and pipetted AML cells and between sorted and pipetted ALL cells are shown in Figure 1—source data 3, Supplementary Table 2 and Figure 1—source data 4, Supplementary Table 3). Figure 1—source data 8 shows the raw metabolomics data for the comparison of AML to ALL cells. (I) Metabolites that significantly changed between AML and ALL cells in sorted versus pipetted samples (listed in Figure 1—source data 5, Supplementary Table 4). (J, K) Correlation between log2 fold changes (in AML versus ALL cells) in sorted versus pipetted samples for all detected metabolites (J) and metabolites that significantly differed between sorted AML and ALL cells (K). (L–P): (L) Number of metabolites above background in 10,000 pipetted WBM cell samples at various times after the death of the mouse (one experiment with n = 5 replicates per time point). (M) Number of metabolites that significantly increased or decreased at each time point relative to the 5 min time point (the metabolites are listed in Figure 1—source data 6, Supplementary Table 5). (N–P) Log2-transformed (N), non-transformed (O), and non-transformed intensity values for metabolites <1×10⁸ (P) in the 5 versus 120 min samples. The statistical significance of differences between treatments was assessed using a paired t-test (A), a Kolmogorov–Smirnov test (B) followed by Holm–Sidak’s multiple comparisons adjustment, repeated measures one-way ANOVA followed by Tukey’s (D) or Dunnett’s (G) multiple comparisons adjustment, repeated measures two-way ANOVA followed by Sidak’s multiple comparisons adjustment (F), or Spearman correlation analysis (J, K, N–P). All statistical tests were two-sided. Data represent mean ± SD. See also Figure 1—figure supplement 1.
Figure 1—figure supplement 1.
Figure 1—figure supplement 1.. Chromatographic performance of lipids separated by HILIC.
(A–D) Representative chromatograms for (A) phosphatidylcholine (PC [36:2]), (B) phosphatidylethanolamine (PE [38:6]), (C) lysophosphatidylcholine (Lyso-PC [18:0]), and (D) lysophosphatidylethanolamine (Lyso-PE [20:4]). (E–H) Standard curves of isotopically labeled lipids from four classes of lipids we detected (black) and the corresponding endogenous lipid (red) for (E) phosphatidylcholine, (F) phosphatidylethanolamine, (G) lysophosphatidylcholine, and (H) lysophosphatidylethanolamine (n = 3 replicates, data represent mean ± SD).
Figure 2.
Figure 2.. Metabolic differences between hematopoietic stem cell (HSC)/multipotent progenitors (MPPs) and whole bone marrow (WBM) cells.
(A) Metabolites significantly above background in 10,000 sorted HSC/MPPs or WBM cells (n = 3–7 replicates per treatment in each of four independent experiments; fold change >2 and false discovery rate [FDR] < 0.05). (B) Metabolites that were significantly depleted (left) or enriched (right) in HSC/MPPs as compared to WBM cells (fold change >2.5, FDR < 0.01; all metabolites with fold change >2.0 and FDR < 0.05 are listed in Figure 2—source data 2, Supplementary Table 1). Data in (A) represent mean ± SD. A comparison of these differences to those observed by Agathocleous et al., 2017 between HSCs and WBM cells is shown in Figure 2—figure supplement 1and a summary of the differences in lipid species is shown in Figure 2—figure supplement 2.
Figure 2—figure supplement 1.
Figure 2—figure supplement 1.. Metabolites that were detected as differing between hematopoietic stem cells (HSCs)/multipotent progenitors (MPPs) and whole bone marrow (WBM) cells using the Agathocleous et al.'s method (Agathocleous et al., 2017) versus the method described in this study.
Metabolites identified by Agathocleous et al. as (A) enriched or (B) depleted in HSC/MPPs as compared to WBM cells and the results obtained for the same metabolites in the current study (data are from Figure 2).
Figure 2—figure supplement 2.
Figure 2—figure supplement 2.. Glycerophospholipids are enriched in hematopoietic stem cell (HSC)/multipotent progenitors (MPPs) as compared to whole bone marrow (WBM) cells.
(A) Schematic of glycerophospholipid metabolism and (B) list of phosphatidylcholines (PC), phosphatidylethanolamines (PE), phosphatidylserines (PS), Lyso-PCs, and Lyso-PEs detected in 10,000 HSCs/MPPs or WBM cells by our method. Red metabolites were enriched in HSC/MPPs and blue metabolites were depleted in HSC/MPPs. Purple metabolites were detected but not significantly changed. Black metabolites were not detected (n = 11 replicates per cell population from a total of four independent experiments).
Figure 3.
Figure 3.. Metabolic differences between methotrexate-treated and control hematopoietic stem cells (HSCs) or circulating melanoma cells and primary tumors.
(A–D) Bone marrow cellularity (A) and the frequencies of CD150+CD48-Lin-Sca1+c-kit+ HSCs (B), CD150-CD48-Lin-Sca1+c-kit+multipotent progenitors (MPPs) (C), and Lin-Sca1+c-kit+ cells (D) in femurs and tibias from mice treated with methotrexate or vehicle control (n = 5 mice per treatment from two independent experiments). (E) Percentage of nucleated blood cells that were donor-derived after competitive transplantation of bone marrow cells from methotrexate-treated versus control mice into irradiated recipients (two independent experiments). (F) AICAR levels in HSC/MPPs from mice treated with methotrexate or vehicle (11 control samples and 9 MTX samples from four independent experiments). (G) Metabolites detected above background in primary tumor cells or circulating melanoma cells (n = 3 or four replicates per treatment in one experiment; fold change >2 and false discovery rate [FDR] < 0.05). (H–K) Levels of the purines inosine monophosphate (IMP) (H), xanthosine monophosphate (XMP) (I), guanosine monophosphate (GMP) (J), and adenosine monophosphate (AMP) (K) in primary tumor and circulating melanoma cells. Statistical significance was assessed by t-test (A), repeated measures two-way ANOVA (B–D), or mixed effects analysis (E) followed by Sidak’s multiple comparisons adjustment. All tests were two-sided. Data represent mean ± SD. The flow cytometry gates used to isolate each cell population are shown in Figure 3—figure supplement 1. All of the metabolites that differed between circulating melanoma cells and subcutaneous tumor cells are listed in Figure 3—source data 2, Supplementary table 1.
Figure 3—figure supplement 1.
Figure 3—figure supplement 1.. Flow cytometry gating strategies.
(A) Flow cytometry gating strategies for isolating CD150+CD48-Lin-Sca1+c-kithematopoietic stem cells (HSCs; 0.0057% of bone marrow cells), CD150-CD48-Lin-Sca1+c-kit+multipotent progenitors (MPPs; 0.0047% of bone marrow cells), and Lin-Sca1+c-kit+ cells (0.19% of bone marrow cells). (B) Flow cytometry gating strategy for isolating live HLA+DsRed+mTer119-mCD45-mCD31- human melanoma cells from mechanically dissociated subcutaneous tumors from xenografted NSG mice (all melanomas were tagged with stable DsRed expression). (C) Flow cytometry gating strategy for isolating live HLA+DsRed+mTer119-mCD45-mCD31- circulating melanoma cells from the blood of xenografted NSG mice.
Figure 4.
Figure 4.. Metabolomic profiling of hematopoietic stem cells (HSCs) isolated by flow cytometry.
(A) Overview of the method. (B) Metabolites detected above background in 10,000 HSCs/multipotent progenitors (MPPs) in this study (green numbers, 159 metabolites total) as compared to our prior study using a different method (Agathocleous et al., 2017) (blue numbers, 57 metabolites total). These data are from one experiment, representative of four independent experiments. Metabolites detected above background were calculated by comparing three whole bone marrow (WBM) or three HSC/MPP samples to three sheath fluid blanks (fold change >2, false discovery rate [FDR] < 0.05).
Author response image 1.

References

    1. Abouleila Y, Onidani K, Ali A, Shoji H, Kawai T, Lim CT, Kumar V, Okaya S, Kato K, Hiyama E, Yanagida T, Masujima T, Shimizu Y, Honda K. Live single cell mass spectrometry reveals cancer-specific metabolic profiles of circulating tumor cells. Cancer Science. 2019;110:697–706. doi: 10.1111/cas.13915. - DOI - PMC - PubMed
    1. Agathocleous M, Meacham CE, Burgess RJ, Piskounova E, Zhao Z, Crane GM, Cowin BL, Bruner E, Murphy MM, Chen W, Spangrude GJ, Hu Z, DeBerardinis RJ, Morrison SJ. Ascorbate regulates haematopoietic stem cell function and leukaemogenesis. Nature. 2017;549:476–481. doi: 10.1038/nature23876. - DOI - PMC - PubMed
    1. Ali A, Abouleila Y, Shimizu Y, Hiyama E, Emara S, Mashaghi A, Hankemeier T. Single-cell metabolomics by mass spectrometry: advances, challenges, and future applications. TrAC Trends in Analytical Chemistry. 2019;120:115436. doi: 10.1016/j.trac.2019.02.033. - DOI
    1. Allegra CJ, Drake JC, Jolivet J, Chabner BA. Inhibition of phosphoribosylaminoimidazolecarboxamide transformylase by methotrexate and dihydrofolic acid polyglutamates. PNAS. 1985;82:4881–4885. doi: 10.1073/pnas.82.15.4881. - DOI - PMC - PubMed
    1. Anders S, Huber W. Differential expression analysis for sequence count data. Genome Biology. 2010;11:R106. doi: 10.1186/gb-2010-11-10-r106. - DOI - PMC - PubMed

Publication types

LinkOut - more resources