. 2021 Aug 2;23(8):1348-1359.
doi: 10.1093/neuonc/noab009.

Therapeutic targeting of transcriptional elongation in diffuse intrinsic pontine glioma

Affiliations

Therapeutic targeting of transcriptional elongation in diffuse intrinsic pontine glioma

Hiroaki Katagi et al. Neuro Oncol. .

Abstract

Background: Diffuse intrinsic pontine glioma (DIPG) is associated with transcriptional dysregulation driven by H3K27 mutation. The super elongation complex (SEC) is required for transcriptional elongation through release of RNA polymerase II (Pol II). Inhibition of transcription elongation by SEC disruption can be an effective therapeutic strategy of H3K27M-mutant DIPG. Here, we tested the effect of pharmacological disruption of the SEC in H3K27M-mutant DIPG to advance understanding of the molecular mechanism and as a new therapeutic strategy for DIPG.

Methods: Short hairpin RNAs (shRNAs) were used to suppress the expression of AF4/FMR2 4 (AFF4), a central SEC component, in H3K27M-mutant DIPG cells. A peptidomimetic lead compound KL-1 was used to disrupt a functional component of SEC. Cell viability assay, colony formation assay, and apoptosis assay were utilized to analyze the effects of KL-1 treatment. RNA- and ChIP-sequencing were used to determine the effects of KL-1 on gene expression and chromatin occupancy. We treated mice bearing H3K27M-mutant DIPG patient-derived xenografts (PDXs) with KL-1. Intracranial tumor growth was monitored by bioluminescence image and therapeutic response was evaluated by animal survival.

Results: Depletion of AFF4 significantly reduced the cell growth of H3K27M-mutant DIPG. KL-1 increased genome-wide Pol II occupancy and suppressed transcription involving multiple cellular processes that promote cell proliferation and differentiation of DIPG. KL-1 treatment suppressed DIPG cell growth, increased apoptosis, and prolonged animal survival with H3K27M-mutant DIPG PDXs.

Conclusions: SEC disruption by KL-1 increased therapeutic benefit in vitro and in vivo, supporting a potential therapeutic activity of KL-1 in H3K27M-mutant DIPG.

Keywords: H3K27M-mutant DIPG; RNA polymerase II (Pol II); patient-derived xenograft (PDX); super elongation complex (SEC); transcriptional elongation.


Figures

Fig. 1
Fig. 1
AFF4 depletion and KL-1 treatment inhibited proliferation and increased apoptosis in diffuse intrinsic pontine glioma (DIPG) cells. (A) Western blotting results showing AFF4, CCNT1, CDK9, and β-actin expression in H3.3K27M-mutant (SF8628 and DIPG-007) and H3.1K27M-mutant DIPG cell lines (SU-DIPG4 and SU-DIPG36), isogenic human astrocytes expressing wild-type (Astro-WT) or K27M H3F3A transgene (Astro-KM), H3F3A G34V-mutant KNS-42 glioblastoma cells, and normal human astrocytes (NHA). (B) Left, western blotting results showing shRNA-mediated depletion of AFF4 expression in SF8628 cells. Middle, cell growth plot showing anti-proliferative effects of shRNA-mediated depletion of AFF4 in SF8628 cells. The plot represents the absorbance quantification (optical density [OD], λ = 490 nm) measured each day. Values shown are the average (mean ± SD) from triplicate samples for each condition. Right, dot plot representation of OD 490 values on day 6. Statistical analysis was performed using a two-tailed unpaired t-test: ****P < .0001. (C) Cell growth plot showing OD 490 values as the proliferation response to KL-1 treatment of SF8628, DIPG-007, SU-DIPG4, and SU-DIPG36 cells at each time point. Values shown are the average (mean ± SD) from duplicate or triplicate samples for each condition. Dot plot representation of OD 490 values on day 6. Statistical analysis was performed using a two-tailed unpaired t-test: SF8628, ****P < .0001; DIPG-007, ***P = .0004; SU-DIPG4, ****P < .0001; SU-DIPG36, ***P = .0002. (D) Left, KL-1 colony forming effect on cells with or without KL-1. Right, bar graph representation of colony numbers in the DIPG cells treated with DMSO or IC50 values of KL-1. Values shown are the average (mean ± SD) from triplicate samples for each condition. Unpaired t-test values for comparisons between the presence and absence of KL-1 treatment: SF8628, ****P < .0001; DIPG-007, ****P < .0001; SU-DIPG4, ****P < .0001; SU-DIPG36, ****P < .0001. (E) Left, Annexin V flow cytometry analysis of KL-1 apoptosis effects. Cells were treated with DMSO (0 µM) or 20 µM and 40 µM KL-1 for 72 h. They were collected and treated with Alexa Fluor 488 Annexin V and flow sorted. Right, bar graph representation of Annexin V-positive cell numbers. Values shown are the average (mean ± SD) from quadruplicate samples for each incubation condition. Unpaired t-test values for comparisons of each KL-1 treatment: SF8628, DMSO vs 40 µM KL-1 *P = .0181; DIPG-007, DMSO vs 20 µM KL-1 *P = .0197, DMSO vs 40 µM KL-1 ****P < .0001.
Fig. 2
Fig. 2
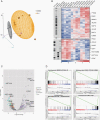
KL-1 treatment altered gene expression in diffuse intrinsic pontine glioma (DIPG) cells. (A) Principal component analysis of RNA-seq in SF8628 DIPG cells. The samples with dots represent a KL-1-treated sample (yellow) or a DMSO-treated sample (grey). (B) Heatmap generated from RNA-seq data, showing expression changes in SF8628 DIPG cells treated with 20 µM and 50 µM KL-1 or DMSO for 6 and 24 h. Black lines within vertical bars to the left indicate genes involved in cell cycle, hypoxia, transcription, and DNA repair pathways from MSigDB (v5.1). The genes in selected pathway are highlighted on the right side. (C) Volcano plots showing differentially expressed genes in SF8628 DIPG cells treated with KL-1 or DMSO. DMSO-treated and KL-1-treated samples are shown as colored dots and colored by associated pathways (x-axis: log2 fold change; y-axis: −log10 FDR [false discovery rate] values). (D) GSEA pathway analysis in KL-1-treated SF8628 DIPG cells. Significantly up-regulated (upper left panel) and down-regulated (upper right and bottom panels) pathways.
Fig. 3
Fig. 3
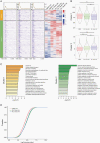
KL-1 altered genome-wide RNA polymerase II (Pol II) occupancy and transcription. (A) Heatmaps generated from Pol II ChIP-seq showing increased Pol II promoter occupancy with DMSO (left panel) vs 20 µM (middle panel) and 50 µM (right panel) KL-1 treatment for 24 h in SF8628 diffuse intrinsic pontine glioma (DIPG) cells. Green and orange lines at the top panels indicate corresponding Pol II occupancy. Two clusters of corresponding gene expression at the Pol II binding sites generated from RNA-seq are shown to the right. (B) Violin plots to compare the expression of the two gene clusters across conditions (top: cluster 1; bottom: cluster 2). Unpaired t-test values for comparisons each treatment: Cluster 1, DMSO (red) vs 20 µM KL-1 (green) P = .9866, DMSO vs 50 µM KL-1 (purple) ***P = .0007, 20 µM KL-1 vs 50 µM KL-1 ***P = .0008; Cluster 2, DMSO vs 20 µM KL-1 ****P < 2.2E-16, DMSO vs 50 µM KL-1 ****P < 2.2E-16, 20 µM KL-1 vs 50 µM KL-1 ***P = .0003. (C) GO enrichment analysis of cluster 1 (left) and cluster 2 genes (right). (D) Empirical cumulative density function (ECDF) plots of Pol II pausing index in SF8628 DIPG cells treated with DMSO (red lines) or KL-1 (20 µM: green line, 50 µM: blue line). Two-sided Kolmogorov-Smirnov test values for comparisons each treatment: DMSO vs 20 µM KL-1 P < 2.2E-16, DMSO vs 50 µM KL-1 P < 2.2E-16, 20 µM KL-1 vs 50 µM KL-1 P = .0008.
Fig. 4
Fig. 4
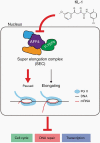
Working model. Targeting transcriptional elongation with KL-1 of the super elongation complex (SEC) blocks multiple cellular processes. KL-1 disrupts the interaction between AFF4 and P-TEFb in the SEC, resulting in impaired release of Pol II from promoter-proximal regions and reduced active transcription elongation, which leads to suppressed transcription involving multiple cellular processes including the cell cycle, DNA repair, and transcription in diffuse intrinsic pontine glioma cells.
Fig. 5
Fig. 5
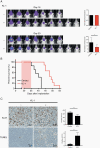
KL-1 showed anti-tumor activity in patient-derived K27M-mutant diffuse intrinsic pontine glioma xenografted mice. Mice with SF8628 intracranial tumors were either treated with vehicle (DMSO, n = 7) or KL-1 (40 mg/kg for 15 consecutive days, n = 9). (A) Left, tumor bioluminescence overlay images showing relative bioluminescence intensities from representative vehicle- vs KL-1-treated mice on days 16 and 23. Right, bar graph representation of normalized bioluminescence value against bioluminescence value obtained at day 16. Values shown are the average (mean ± SD) from each mouse. Unpaired t-test values for comparisons of each treatment: control vs KL-1, *P = .0225. (B) Corresponding survival plots of each treatment group. Statistical analysis was performed using a log-rank test: control vs KL-1, P < .0001. (C) Left, images of representative Ki-67 and TUNEL staining for intracranial tumors from mice euthanized at the end of treatment. The scale bar is defined as the length of 50 μm. Right, mean and SD values representing the average number of positive cells in four high-powered fields in each tumor. Statistical analysis was performed using the unpaired t-test. Ki-67: DMSO vs KL-1, **P = .0075. TUNEL: DMSO vs KL-1, **P = .0027.

Comment in

References

    1. Warren KE. Diffuse intrinsic pontine glioma: poised for progress. Front Oncol. 2012;2:205. - PMC - PubMed
    1. Robison NJ, Kieran MW. Diffuse intrinsic pontine glioma: a reassessment. J Neurooncol. 2014;119(1):7–15. - PubMed
    1. Schwartzentruber J, Korshunov A, Liu XY, et al. . Driver mutations in histone H3.3 and chromatin remodelling genes in paediatric glioblastoma. Nature. 2012;482(7384):226–231. - PubMed
    1. Wu G, Broniscer A, McEachron TA, et al. ; St. Jude Children’s Research Hospital–Washington University Pediatric Cancer Genome Project . Somatic histone H3 alterations in pediatric diffuse intrinsic pontine gliomas and non-brainstem glioblastomas. Nat Genet. 2012;44(3):251–253. - PMC - PubMed
    1. Chan KM, Fang D, Gan H, et al. . The histone H3.3K27M mutation in pediatric glioma reprograms H3K27 methylation and gene expression. Genes Dev. 2013;27(9):985–990. - PMC - PubMed

Publication types