

Vegan diet in young children remodels metabolism and challenges the statuses of essential nutrients
- PMID: 33471422
- PMCID: PMC7863396
- DOI: 10.15252/emmm.202013492
Vegan diet in young children remodels metabolism and challenges the statuses of essential nutrients
Abstract
Vegan diets are gaining popularity, also in families with young children. However, the effects of strict plant-based diets on metabolism and micronutrient status of children are unknown. We recruited 40 Finnish children with a median age 3.5 years-vegans, vegetarians, or omnivores from same daycare centers-for a cross-sectional study. They enjoyed nutritionist-planned vegan or omnivore meals in daycare, and the full diets were analyzed with questionnaires and food records. Detailed analysis of serum metabolomics and biomarkers indicated vitamin A insufficiency and border-line sufficient vitamin D in all vegan participants. Their serum total, HDL and LDL cholesterol, essential amino acid, and docosahexaenoic n-3 fatty acid (DHA) levels were markedly low and primary bile acid biosynthesis, and phospholipid balance was distinct from omnivores. Possible combination of low vitamin A and DHA status raise concern for their visual health. Our evidence indicates that (i) vitamin A and D status of vegan children requires special attention; (ii) dietary recommendations for children cannot be extrapolated from adult vegan studies; and (iii) longitudinal studies on infant-onset vegan diets are warranted.
Keywords: development; metabolism; nutrition; vegan; vitamin.
© 2021 The Authors. Published under the terms of the CC BY 4.0 license.
Conflict of interest statement
TH, RF, ES, PI, MN, JN, and HG have nothing to disclose. LK was a board member of the company TwoDads at the time of the study. ME and LK disclose author's fee from Finnish Medical Journal Duodecim. NZ is the founder and scientific advisor of General Metabolics. AS has obtained speaker fees from Orion Pharma and is part of Khondrion SAB, unrelated to the current study.
Figures
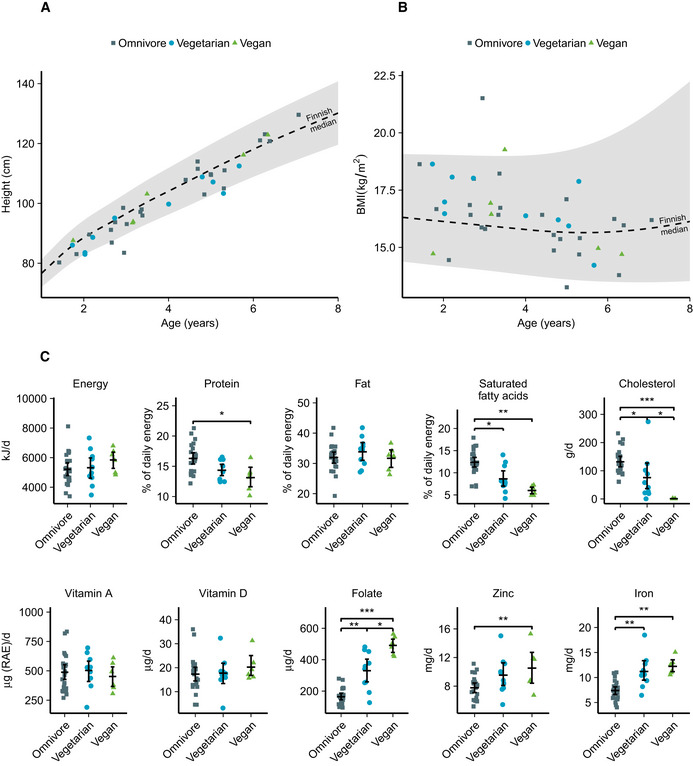
- A, B
Height (A) and body mass index (B) of the participants by age in the diet groups compared to 2 SD intervals (shaded area) and median in the Finnish reference population.
- C
Dietary intake of selected macro‐ and micronutrients of participants.
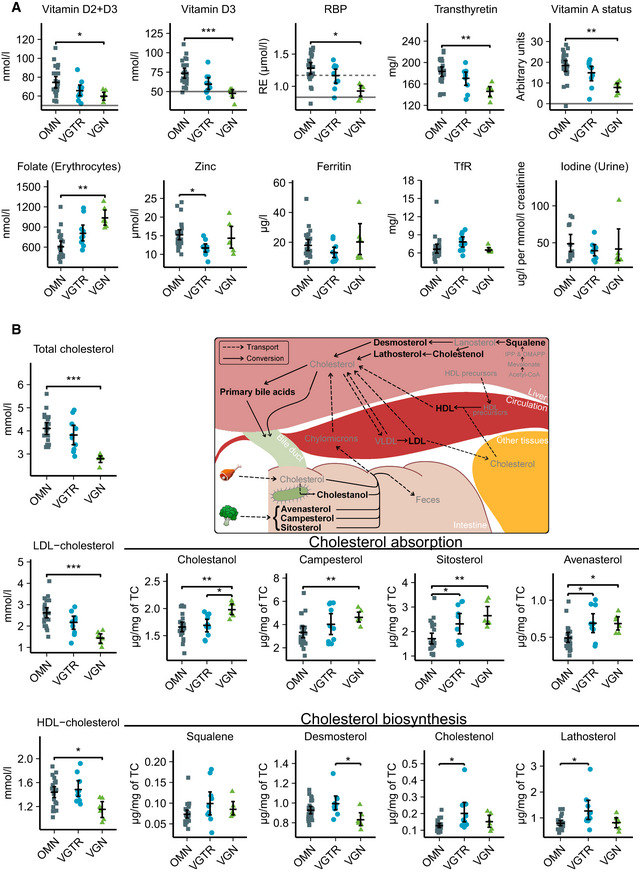
Serum, plasma, or urine levels of vitamin D, vitamin A, folate, zinc, iron, and iodine status biomarkers in diet groups. Solid lines indicate cut‐offs for deficiency, and dashed lines indicate cut‐offs for insufficiency. The RBP limits for vitamin A insufficiency and deficiency are validated for the method at 1.17 and 0.83 µmol/l, respectively. Vitamin A status was calculated based on RBP, transthyretin, and CRP (Talsma et al, 2015).
Cholesterol metabolism biomarkers in the diet groups. The subfigure summarizes cholesterol metabolism in humans and highlights cholesterol‐related metabolites measured in this study with black font (Risley, 2002; Nelson & Cox, 2012).
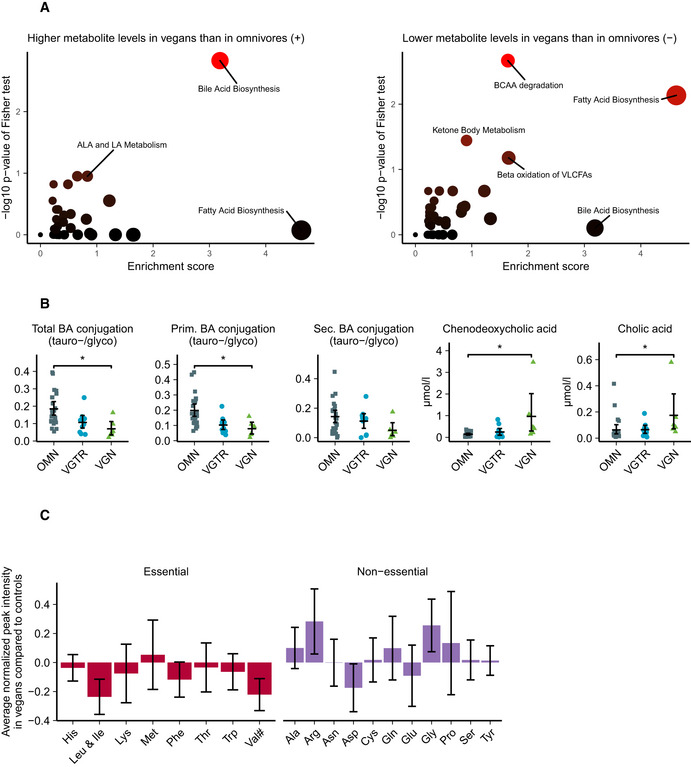
Pathway analysis from 872 detected untargeted metabolites between omnivores and vegans.
Targeted analysis of bile acid concentrations in serum of omnivores, vegetarians and vegans.
Amino acid levels in untargeted metabolomics. Numeric means and standard deviations in this figure can be found in Appendix Table S4. #Valine and betaine are two major components under the same m/z peak, causing uncertainty in the interpretation of valine levels.
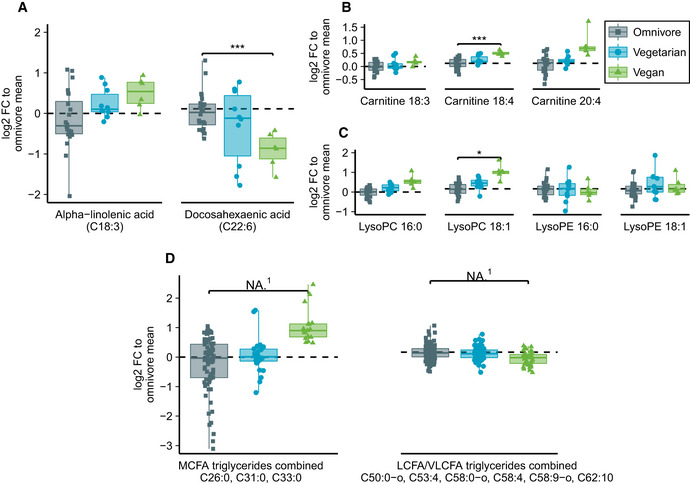
Fatty acid analysis from untargeted MS metabolomics including free alpha‐linolenic acid (ALA) and docosahexaenoic acid (DHA).
Carnitine‐bound fatty acids commonly found in serum that were detected in mass spectrometry.
Lysophosphatidylcholine and lysophosphatidylethanolamine with C16:0 (palmitic acid) and C18:1 (oleic acid).
Combined analysis of all found triglycerides corresponding to medium‐chain fatty acid lengths and long or very long‐chain fatty acid lengths.
Comment in
-
Metabolomics: insights into plant-based diets.EMBO Mol Med. 2021 Feb 5;13(2):e13568. doi: 10.15252/emmm.202013568. Epub 2021 Feb 1. EMBO Mol Med. 2021. PMID: 33522109 Free PMC article.
References
-
- Appleby PN, Key TJ (2016) The long‐term health of vegetarians and vegans. Proc Nutr Soc 75: 287–293 - PubMed
-
- Barbara L, Lazzari R, Roda A, Aldini R, Festi D, Sama C, Morselli AM, Collina A, Bazzoli F, Mazzella G et al (1980) Serum bile acids in newborns and children. Pediatr Res 14: 1222–1225 - PubMed
-
- Brown MS, Goldstein JL (1986) A receptor‐mediated pathway for cholesterol homeostasis. Science 232: 34–47 - PubMed
Publication types
MeSH terms
LinkOut - more resources
Full Text Sources
Other Literature Sources
Medical
