. 2021 Mar 1;125(3):796-804.
doi: 10.1152/jn.00106.2020. Epub 2021 Jan 20.

Modulation of saccade trajectories during sequential saccades

Affiliations

Modulation of saccade trajectories during sequential saccades

Reza Azadi et al. J Neurophysiol. .

Abstract

The planning and execution of sequential saccades can overlap in time, and abrupt changes in neural activity in the oculomotor system can alter the normal trajectory of saccades. In this study, we analyzed saccade trajectories to assess the combined programming of sequential saccades. In two separate psychophysical experiments, subjects were instructed to make a sequence of two saccades. The results showed modulation of saccade curvature by the direction and amplitude of both the preceding and following saccade: saccade curvature is modulated in the direction of preceding saccades and away from the direction of following saccades. Moreover, larger preceding and following saccades have stronger effects on curvature. These results support the idea that sequential saccades are programmed concurrently. Finally, the amount of saccade curvature is correlated with the deviation of saccade start and end points, and the time of maximum deviation of saccade trajectories is highly consistent in both experiments. Based on this, we propose a novel benefit for the modulation of saccade trajectories by the oculomotor system: minimizing the saccadic error in sequential saccades.NEW & NOTEWORTHY We show that in saccade sequences, saccade trajectory is modulated in the direction of the preceding saccade and away from the following saccade. The magnitude of this effect is correlated with preceding and following saccade amplitude. This confirms that programming of sequential saccades overlaps. Curvature is also correlated with the deviation of saccade start and end points. Thus, we propose a novel benefit for the modulation of saccade trajectories: minimizing end point error in sequential saccades.

Keywords: curvature; eye movement; saccade; saccade sequence.


Conflict of interest statement

No conflicts of interest, financial or otherwise, are declared by the authors.

Figures

None
Graphical abstract
Figure 1.
Figure 1.
A: schematic of the trial sequences and five trial types in experiment 1 (test saccade follows an initial saccade): 1) The fixation point appears and subjects start fixation; a small line cues the direction of the second saccade. 2) The fixation point disappears after 1,000 ± 250 ms, and simultaneously five peripheral visual stimuli appear. 3) Subjects first make a saccade to the middle target as quickly as possible. 4) A second saccade toward the final target is made and subjects are required to hold fixation for 400 ms. B: experiment 2 (test saccade precedes a subsequent saccade): 1) The fixation point is presented at one of the five locations depending on the trial type and the subject starts fixation. 2) After 1,000 ± 250 ms, the fixation circle disappears and simultaneously two targets appear on the midline. Subjects are instructed to perform 3) the first saccade horizontally to the upper target and 4) a second saccade to the lower target and hold fixation for 400 ms. C: schematic of the procedure for calculating saccadic curvature based on the area under the curve of saccadic trajectory from a line connecting the saccade start and end points. Note that clockwise curvatures (A1 in this example) are defined as negative values and vice versa.
Figure 2.
Figure 2.
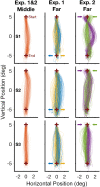
Saccade trajectories for typical subjects in experiments 1 and 2. Each row represents data from a typical subject. The left column is the saccade trajectories in the single-saccade control trials, when subjects performed only one saccade in both experiments. The middle and right columns represent data from the far trials, respectively in experiments 1 and 2, and the arrows indicate the following and preceding saccade directions. Individual differences are noticeable between the subjects, as well as asymmetry between the saccade trajectories in the right and left trials. All 200 control trials in experiments 1 and 2 and all 100 trials in each condition are presented here.
Figure 3.
Figure 3.
A descriptive analysis of saccade curvatures in experiment 1 (top) and experiment 2 (bottom). These box-and-whisker plots illustrate saccade curvatures in each trial type for each subject, and data from all single trials are presented on these plots. Each point represents data from a single trial; bars indicate the lower and upper quartile of saccadic curvature in each trial type for each subject (subjects are color-coded) and the white lines indicate the medians. The error bars (the whiskers) indicate 1.5 times the IQR (the distance between the upper and lower quartiles). Black circles represent the average saccade curvature for each subject, and black lines indicate the average saccade curvature across all subjects for each trial type (thick lines) ± 1 standard deviation (thin lines). P values are obtained from pairwise t tests corrected by Benjamini–Hochberg (BH) procedure.
Figure 4.
Figure 4.
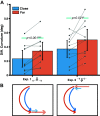
A: difference in saccade curvature of the left and the right trials, for far (red) and close (blue) second target (experiment 1, left) and fixation (experiment 2, right) position; the circles indicate data from each individual subject and the error bars indicate 95% confidence intervals across subjects. B: schematic of saccadic trajectories for far (red) and close (blue) trials (only one side is presented here): saccades curve away from the direction following saccades (experiment 1, left) and curve toward the direction of preceding saccades (experiment 2, right). This modulation of curvature is stronger for when the following or preceding saccades are larger (far trials).
Figure 5.
Figure 5.
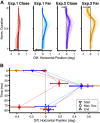
Saccade trajectory deviation in each trial type as a function of time. A: horizontal component of the saccade trajectories from the left and right trials have been subtracted and plotted as a function of time. The arrows indicate the corresponding direction of preceding and flowing saccades. Thin lines indicate data from individual subjects and thick lines are the averages across all subjects; the shaded areas indicate 95% confidence intervals (CIs) across subjects. B: averaged saccade start, maximum deviation, and end points across all subjects. The same color codes as A of this figure have been used; the error bars indicate 95% CIs across subjects.
Figure. 6.
Figure. 6.
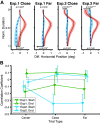
The saccade trajectory deviation for saccades with high and low curvature separately. A: data for each subject and trial type were divided into saccades with high and low curvature and then the horizontal component of the saccade trajectories from the left and right trials were subtracted and plotted as a function of time. Arrows indicate the corresponding direction of preceding and following saccades. Blue dashed lines indicate data from saccades with lower curvature and the red solid lines indicate data from the saccades with higher curvature. The P values indicate the significance between the horizontal components of saccade start and end points, obtained by paired t test corrected by the Benjamini–Hochberg (BH) procedure. The shaded areas indicate 95% confidence intervals (CIs) across subjects. B: average correlation coefficient across all subjects between saccade curvature and saccade start and end points in experiment 1 (green) and experiment 2 (cyan). Filled triangles indicate significant difference between the averaged correlation and zero; the error bars indicate CIs across subjects.

References

    1. Yarbus AL. Eye movements during perception of complex objects. In: Eye Movements and Vision. Boston, MA: Springer US, 1967, p. 171–211. doi:10.1007/978-1-4899-5379-7_8. - DOI
    1. Ludwig CJH, Gilchrist ID. Measuring saccade curvature: a curve-fitting approach. Behav Res Methods Instrum Comput 34: 618–624, 2002. doi:10.3758/bf03195490. - DOI - PubMed
    1. Smit AC, Van Gisbergen JA. An analysis of curvature in fast and slow human saccades. Exp Brain Res 81: 335–345, 1990. doi:10.1007/BF00228124. - DOI - PubMed
    1. Viviani P, Berthoz A, Tracey D. The curvature of oblique saccades. Vision Res 17: 661–664, 1977. doi:10.1016/0042-6989(77)90143-2. - DOI - PubMed
    1. Godijn R, Theeuwes J. Programming of endogenous and exogenous saccades: evidence for a competitive integration model. J Exp Psychol Hum Percept Perform 28: 1039–1054, 2002. doi:10.1037/0096-1523.28.5.1039. - DOI - PubMed

Publication types

LinkOut - more resources