

Estimating and interpreting secondary attack risk: Binomial considered biased
- PMID: 33471806
- PMCID: PMC7850487
- DOI: 10.1371/journal.pcbi.1008601
Estimating and interpreting secondary attack risk: Binomial considered biased
Abstract
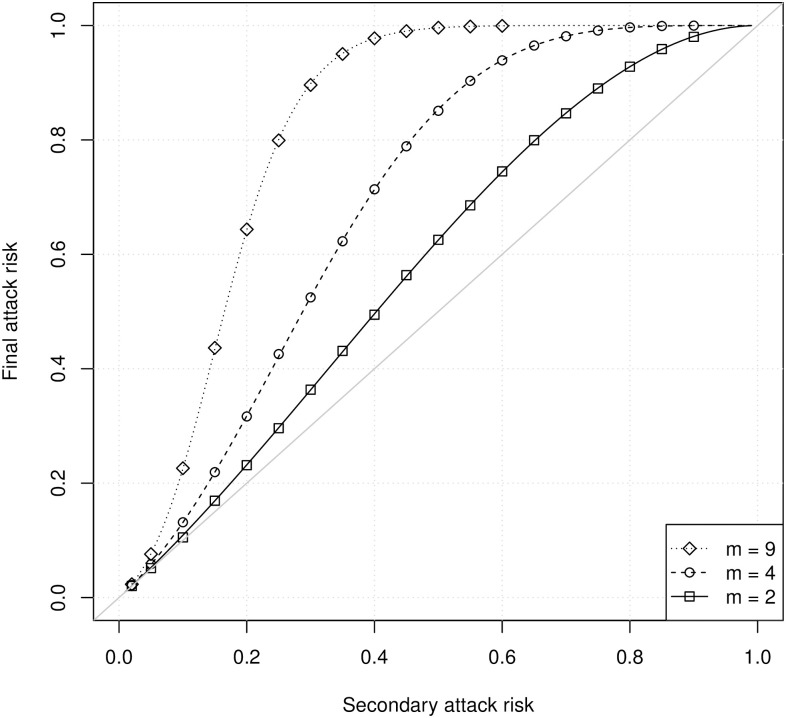
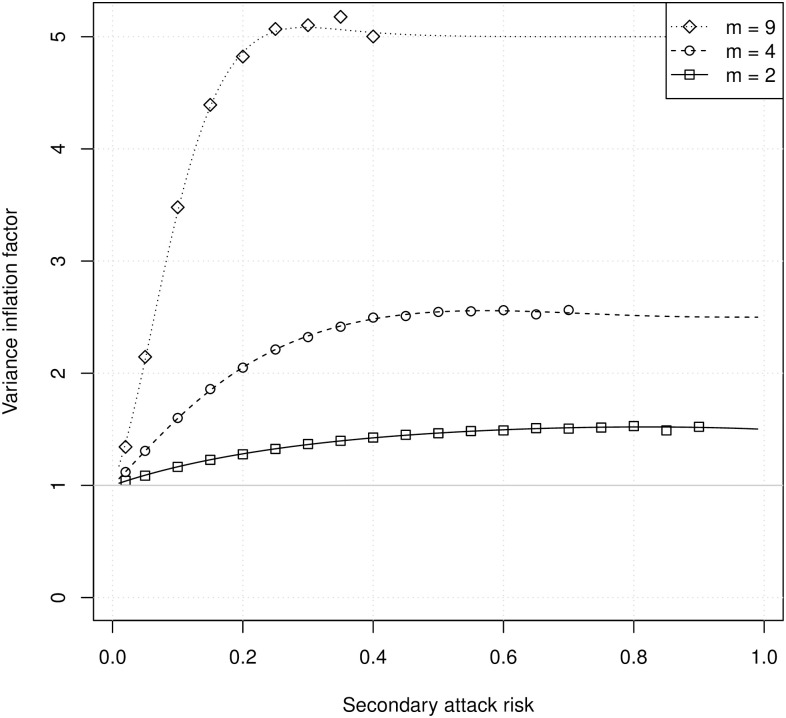
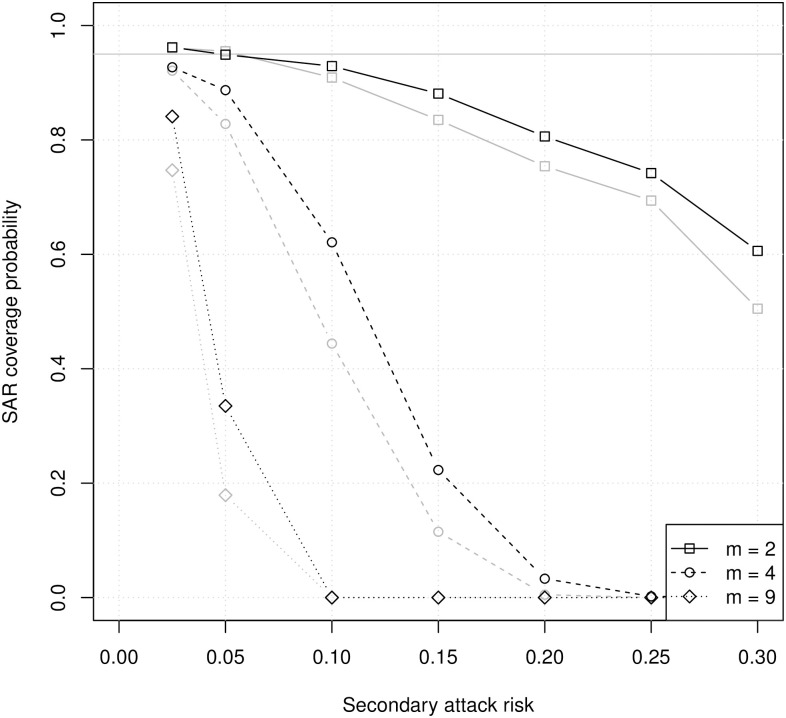
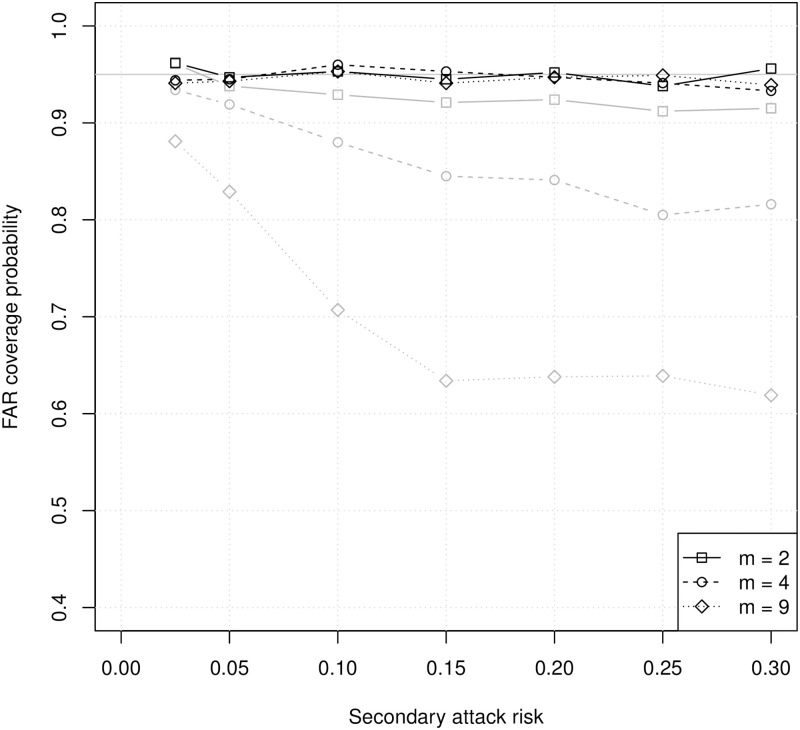
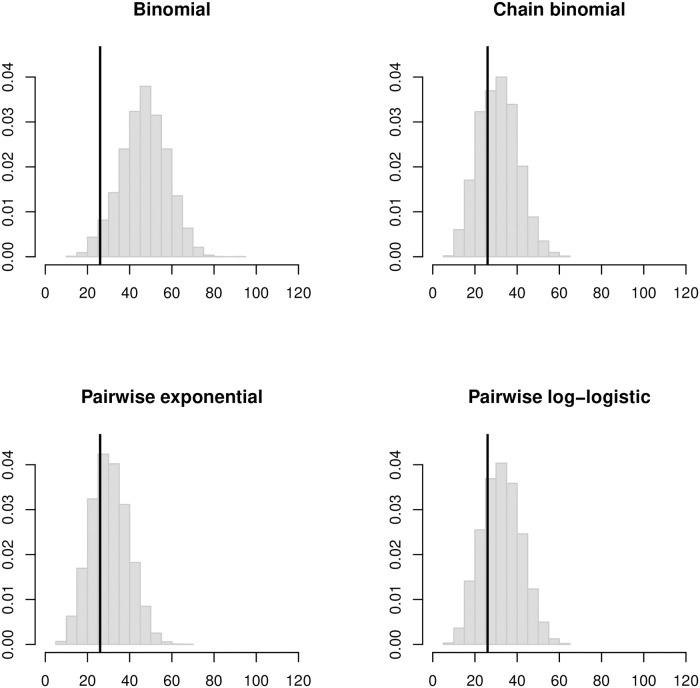
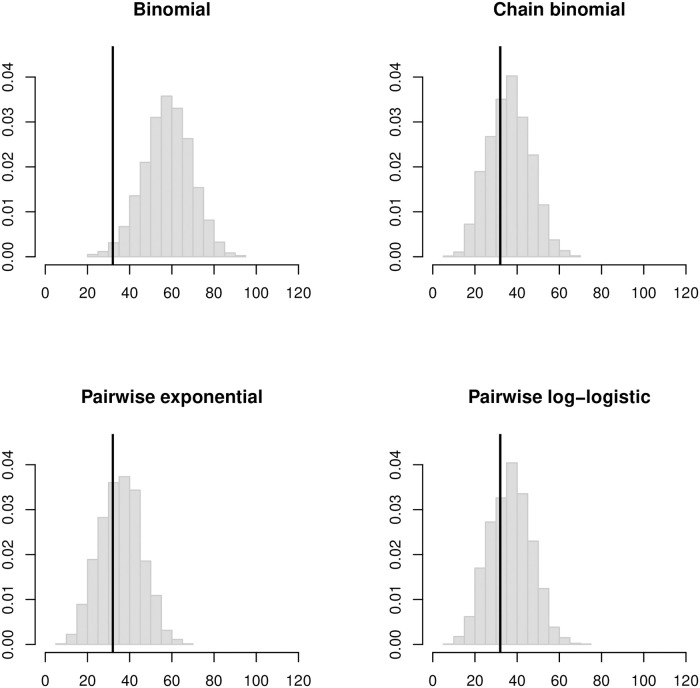
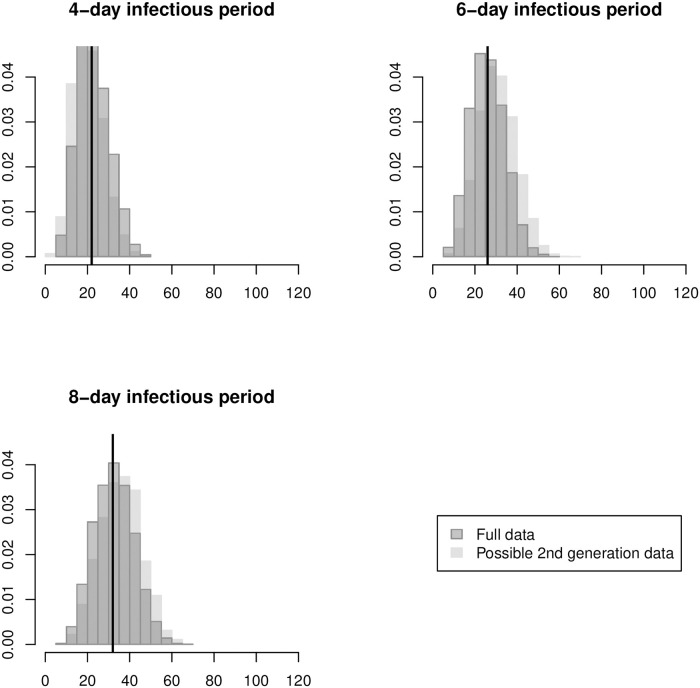
The household secondary attack risk (SAR), often called the secondary attack rate or secondary infection risk, is the probability of infectious contact from an infectious household member A to a given household member B, where we define infectious contact to be a contact sufficient to infect B if he or she is susceptible. Estimation of the SAR is an important part of understanding and controlling the transmission of infectious diseases. In practice, it is most often estimated using binomial models such as logistic regression, which implicitly attribute all secondary infections in a household to the primary case. In the simplest case, the number of secondary infections in a household with m susceptibles and a single primary case is modeled as a binomial(m, p) random variable where p is the SAR. Although it has long been understood that transmission within households is not binomial, it is thought that multiple generations of transmission can be neglected safely when p is small. We use probability generating functions and simulations to show that this is a mistake. The proportion of susceptible household members infected can be substantially larger than the SAR even when p is small. As a result, binomial estimates of the SAR are biased upward and their confidence intervals have poor coverage probabilities even if adjusted for clustering. Accurate point and interval estimates of the SAR can be obtained using longitudinal chain binomial models or pairwise survival analysis, which account for multiple generations of transmission within households, the ongoing risk of infection from outside the household, and incomplete follow-up. We illustrate the practical implications of these results in an analysis of household surveillance data collected by the Los Angeles County Department of Public Health during the 2009 influenza A (H1N1) pandemic.
Conflict of interest statement
The authors have declared that no competing interests exist.
Figures

Similar articles
-
Surveillance of influenza from household to community in Taiwan.Trans R Soc Trop Med Hyg. 2014 Apr;108(4):213-20. doi: 10.1093/trstmh/tru023. Trans R Soc Trop Med Hyg. 2014. PMID: 24627426
-
Household transmission of influenza A and B in a school-based study of non-pharmaceutical interventions.Epidemics. 2013 Dec;5(4):181-6. doi: 10.1016/j.epidem.2013.09.001. Epub 2013 Sep 26. Epidemics. 2013. PMID: 24267874 Clinical Trial.
-
A random graph model for the final-size distribution of household infections.Stat Med. 1996 Apr 15-May 15;15(7-9):837-43. doi: 10.1002/(sici)1097-0258(19960415)15:7/9<837::aid-sim253>3.0.co;2-v. Stat Med. 1996. PMID: 9132909
-
Secondary attack rate of pandemic influenza A(H1N1) 2009 in Western Australian households, 29 May-7 August 2009.Euro Surveill. 2011 Jan 20;16(3):19765. Euro Surveill. 2011. PMID: 21262182
-
Household Transmission of Influenza Virus.Trends Microbiol. 2016 Feb;24(2):123-133. doi: 10.1016/j.tim.2015.10.012. Epub 2015 Nov 21. Trends Microbiol. 2016. PMID: 26612500 Free PMC article. Review.
Cited by
-
Quantifying individual-level heterogeneity in infectiousness and susceptibility through household studies.medRxiv [Preprint]. 2022 Dec 6:2022.12.02.22281853. doi: 10.1101/2022.12.02.22281853. medRxiv. 2022. Update in: Epidemics. 2023 Sep;44:100710. doi: 10.1016/j.epidem.2023.100710. PMID: 36523404 Free PMC article. Updated. Preprint.
-
Results of contact tracing for SARS-CoV-2 Omicron sub-lineages (BA.4, BA.5, BA.2.75) and the household secondary attack risk.Osong Public Health Res Perspect. 2023 Jun;14(3):173-179. doi: 10.24171/j.phrp.2022.0285. Epub 2023 Jun 22. Osong Public Health Res Perspect. 2023. PMID: 37415434 Free PMC article.
-
Pairwise Accelerated Failure Time Regression Models for Infectious Disease Transmission in Close-Contact Groups With External Sources of Infection.Stat Med. 2024 Nov 30;43(27):5138-5154. doi: 10.1002/sim.10226. Epub 2024 Oct 3. Stat Med. 2024. PMID: 39362790 Free PMC article.
-
Increased household transmission and immune escape of the SARS-CoV-2 Omicron compared to Delta variants.Nat Commun. 2022 Sep 29;13(1):5706. doi: 10.1038/s41467-022-33233-9. Nat Commun. 2022. PMID: 36175424 Free PMC article.
-
Retrospective, Observational Studies for Estimating Vaccine Effects on the Secondary Attack Rate of SARS-CoV-2.Am J Epidemiol. 2023 Jun 2;192(6):1016-1028. doi: 10.1093/aje/kwad046. Am J Epidemiol. 2023. PMID: 36883907 Free PMC article.
References
-
- De Wals P, Hertoghe L, Borlée-Grimée I, De Maeyer-Cleempoel S, Reginster-Haneuse G, Dachy A, et al. Meningococcal disease in Belgium. Secondary attack rate among household, day-care nursery and pre-elementary school contacts. Journal of Infection. 1981;3:53–61. 10.1016/S0163-4453(81)80009-6 - DOI - PubMed
Publication types
MeSH terms
Grants and funding
LinkOut - more resources
Full Text Sources
Other Literature Sources
Research Materials
Miscellaneous
