. 2021 Mar 17;12(3):235-247.e9.
doi: 10.1016/j.cels.2020.12.002. Epub 2021 Jan 19.

A platform for experimental precision medicine: The extended BXD mouse family

Affiliations

A platform for experimental precision medicine: The extended BXD mouse family

David G Ashbrook et al. Cell Syst. .

Abstract

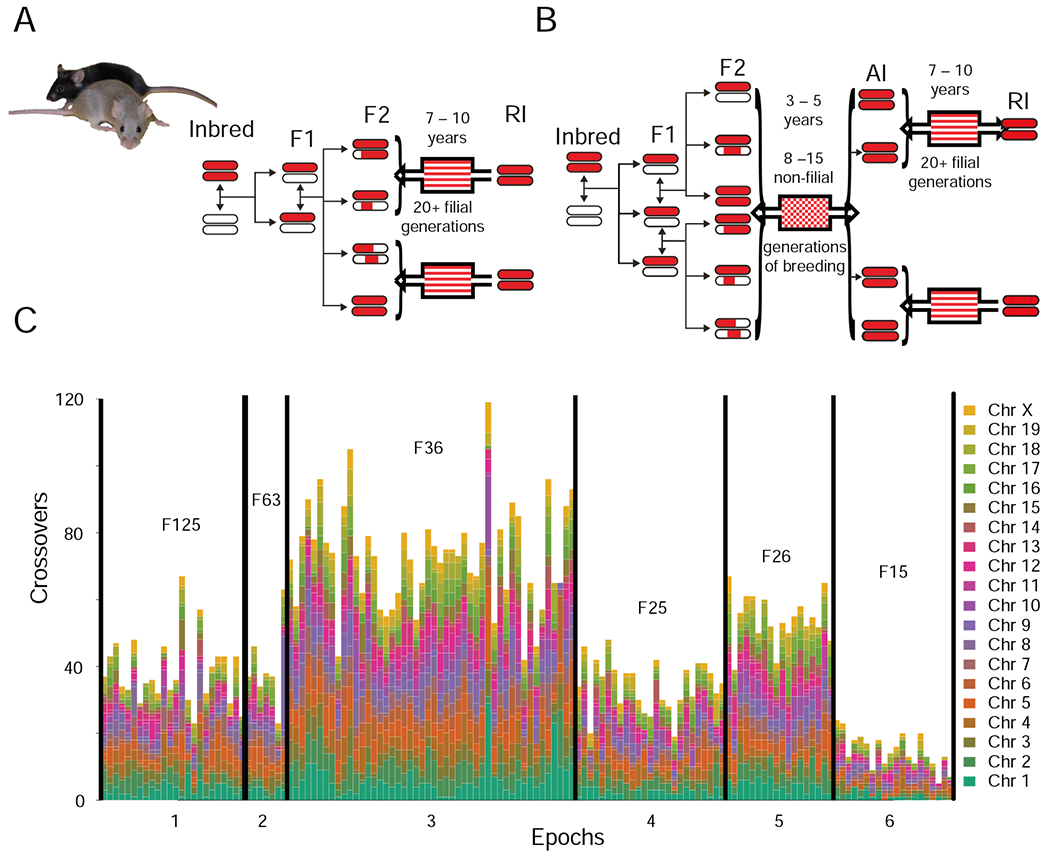
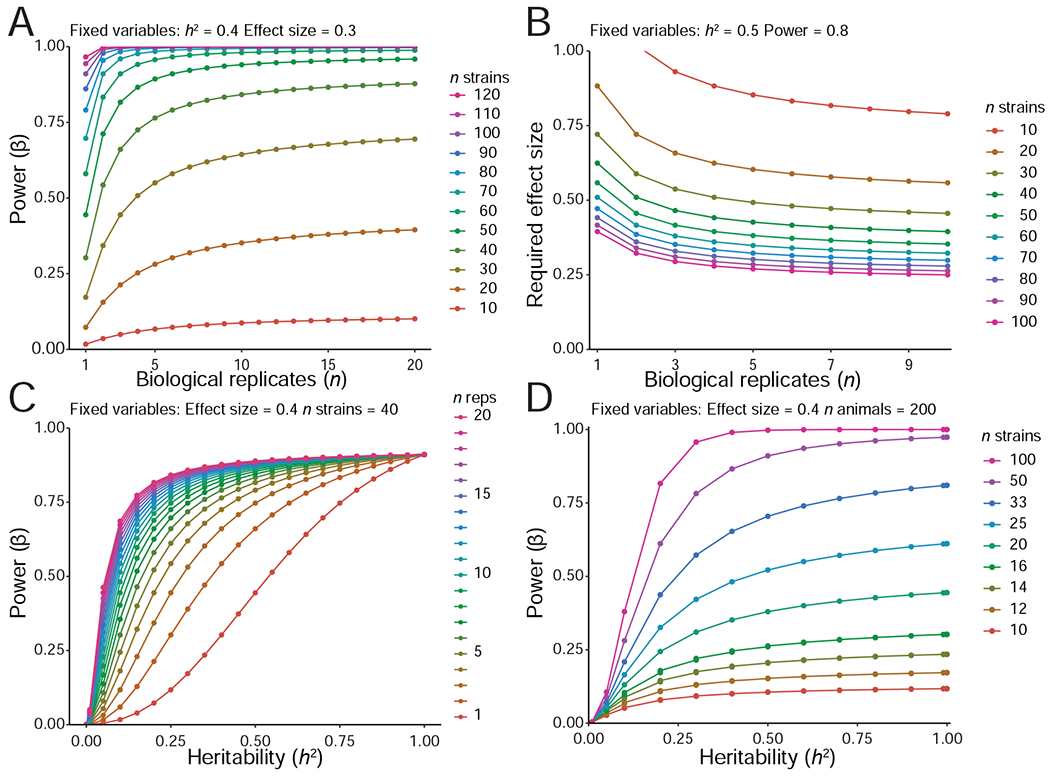
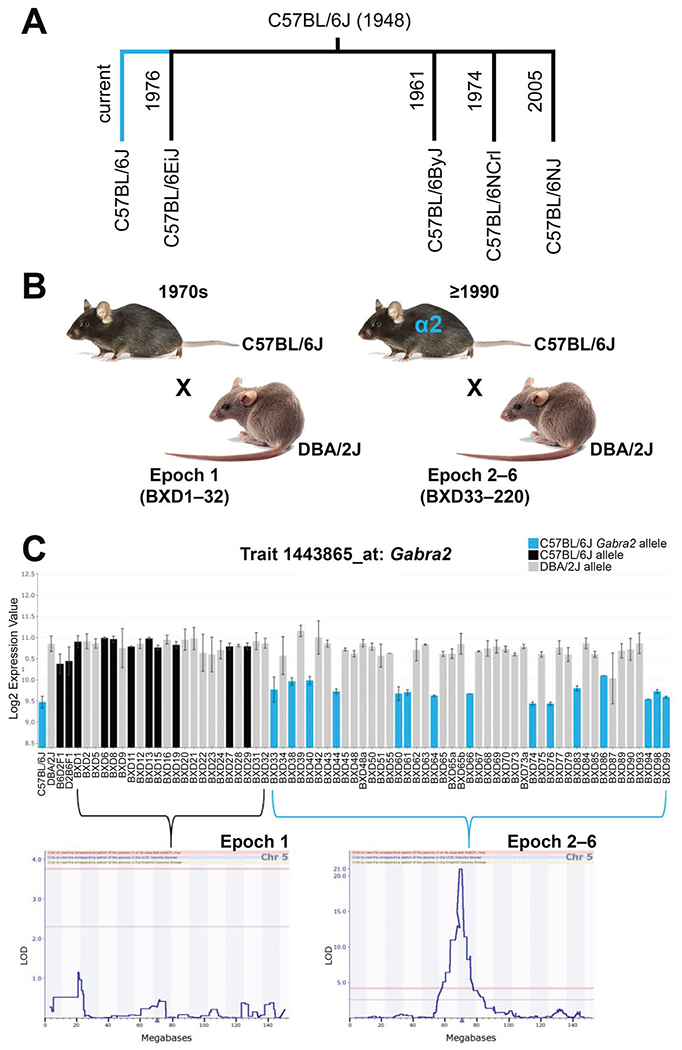
The challenge of precision medicine is to model complex interactions among DNA variants, phenotypes, development, environments, and treatments. We address this challenge by expanding the BXD family of mice to 140 fully isogenic strains, creating a uniquely powerful model for precision medicine. This family segregates for 6 million common DNA variants-a level that exceeds many human populations. Because each member can be replicated, heritable traits can be mapped with high power and precision. Current BXD phenomes are unsurpassed in coverage and include much omics data and thousands of quantitative traits. BXDs can be extended by a single-generation cross to as many as 19,460 isogenic F1 progeny, and this extended BXD family is an effective platform for testing causal modeling and for predictive validation. BXDs are a unique core resource for the field of experimental precision medicine.

Keywords: GXE; complex trait; gene mapping; personalized medicine; power calculation; recombinant inbred strains; systems biology; systems genetics.


Conflict of interest statement

Declaration of interests The authors declare no competing interests.

Figures

Figure 1:
Figure 1:. Production of the BXD family by standard F2 (A) or advanced intercross (B), and recombination differences (C).
Four epochs of the BXD were derived from F2 (A) (~75 strains; epochs 1,2,4,6 in C). Two epochs were derived from advanced intercross (B) (~65 strains; epochs 3, 5 in C). Red represents regions of the genome coming from C57BL/6J (B6), white represents regions from the DBA/2J (D2). Solid lines represent a single generation. Adapted from Peirce et al., 2004. (C) Genome wide visualization of recombinations in the BXD. Number of recombinations per strain (nRecS), ignoring heterozygous and unknown genotypes plotted using a color gradient. Strain numbers on the X-axis, horizontal lines separate the epochs, epochs are annotated on the X-axis. Mean number of inbreeding generations is shown for each epoch. Epoch 6 appears to have fewer recombinations due to a large number of heterozygous loci at genotyping. Details in Figure S1 and Table S1.
Figure 2:
Figure 2:. Improved, denser, genotypes increase linkage across chromosomes, decades of work, and number of strains.
Comparison of current (A) and classic (B) genotypes for BXD_10666, Cytotoxic T-cell (CTL) response (5 x 10^9 PFU AdLacZ iv), measured as interleukin 6 (IL-6) cytokine expression [pg/ml], published by Zhang et al., 2004, measured in 23 strains. A QTL on chromosome 7 is now significant (above the red p = 0.05 significance line) using the current genotypes (A), compared to the classic genotypes (B). Additional examples in Figure S2. (C) Bar chart showing the number of phenotypes with a peak LOD score over the suggestive (LOD ≥ 2.2; p ≤ 0.63), significant (LOD ≥ 3.6; p ≤ 0.05) and highly significant (LOD ≥ 5.4; p ≤ 0.001) thresholds, using original, classic or current marker maps. (D) Percentage increase in the number of traits passing the thresholds in the classic or current genotype map, compared to the original map.
Figure 3:
Figure 3:. Improvement in mapping by using linear mixed models (LMMs) vs Haley-Knott regression (H-K).
Linkage measured in 3300 phenotypes from GeneNetwork, and mapped using Haley-Knott regression or an LMM in R/qtl2 (Broman et al., 2003, 2019). Y-axis is difference in LOD from the significance threshold (calculated by 5000 permutations) and the peak LOD. X-axis is the peak LOD, calculated by LMM, so that points can be directly compared. Each point represents a phenotype, LMM results plotted turquoise, Haley-Knott plotted red. A smoother was fitted in the same colors for comparison. Underlying data in Table S2.
Figure 4:
Figure 4:. Empirical QTL mapping precision estimated using cis-eQTLs.
Each point shows the distance between a probe and an eQTL. (A) Precision achieved when mapping modest QTLs with LOD scores of 3-5 and using only 20-40 strains and 2-4 samples per strain. Number of replicates within each strain will affect the precision to a greater extent for QTLs with low heritability and modest LOD scores by increasing the effective heritability (see Belknap 1998). eQTL studies generally use only 1–4 replicates, so precision values are conservative. Mean offset across the genome is 4.67 Mb, median 2.72 Mb. (B) Precision achieved when mapping highly significant QTLs with LOD > 5, using 60–80 strains, with > 2 replicates. Mean offset is 1.38 Mb, median 0.76 Mb.
Figure 5:
Figure 5:. Relations between power, numbers of strains and replicates in BXD, generated using qtlDesign (Sen et al., 2007).
(A) Power to detect a given effect for n replicates and n strains. Locus effect size and heritability constant at 0.3 and 0.4 respectively. More replicates increase power but beyond four replicates gain in power is marginal. (B) Effect size detectable, given n replicates and strains. Heritability and power kept at 0.5 and 0.8. (C) Power to detect a given effect size, dependent upon heritability and n biological replicates. Locus effect size and n strains kept at 0.4 and 40. With very low h2 there is no power, and with lower h2 the gain in power is stronger with increasing number of replicates compared with high h2. Beyond four replicates, the gain in power is marginal. (D) Power to detect a given effect size, dependent upon heritability, with a total of 200 animals. These range from 100 lines with 2 replicates to 10 lines with 20 replicates. In contrast to what one might assume, even for low levels of h2, power always increases with more lines rather than more replicates. Effect size kept at 0.4. Empirical example of power in the BXD can be found in Figure S3.
Figure 6:
Figure 6:. Impact of epoch-specific mutations in the BXD family.
(A) A private mutation (single nucleotide intronic deletion) in the Gamma-aminobutyric acid (GABA-A) receptor, subunit alpha 2 (Gabra2) gene occurred in the C57BL/6J lineage (turquoise line). The spontaneous mutation was fixed in Jackson Laboratory C57BL/6J foundation stock after separation of the C57BL/6EiJ substrain (1976), and (B) after the creation of the first BXD epoch (1970s). All BXD epochs (2–6) created after 1990 are derived from separate crosses between C57BL/6J and DBA/2J mice and segregate for the C57BL/6J Gabra2 mutant allele (shown in turquoise). (C) Inheritance of the C57BL/6J mutant allele (turquoise) results in a reduction of brain Gabra2 expression levels relative to the ancestral C57BL/6J (black) or DBA/2J (gray) allele. Allele color coded based on Gabra2 genotype at rs13478320. Gabra2 mRNA expression values (trait 1443865) are shown for the hippocampus but are replicated in other brain regions and at the protein level. QTL mapping in epoch 1 or later epochs demonstrates how the absence or presence of segregating C57BL/6J mutant Gabra2 alleles controls gene expression.

References

    1. Andreux PA, Williams EG, Koutnikova H, Houtkooper RH, Champy M-F, Henry H, Schoonjans K, Williams RW, and Auwerx J (2012). Systems genetics of metabolism: the use of the BXD murine reference panel for multiscalar integration of traits. Cell 150, 1287–1299. - PMC - PubMed
    1. Arends D, Prins P, Jansen RC, and Broman KW (2010). R/qtl: high-throughput multiple QTL mapping. Bioinformatics 26, 2990–2992. - PMC - PubMed
    1. Ashbrook DG, and Hager R (2013). Empirical testing of hypotheses about the evolution of genomic imprinting in mammals. Front Neuroanat 7, 6. - PMC - PubMed
    1. Ashbrook DG, Williams RW, Lu L, Stein JL, Hibar DP, Nichols TE, Medland SE, Thompson PM, and Hager R (2014a). Joint genetic analysis of hippocampal size in mouse and human identifies a novel gene linked to neurodegenerative disease. BMC Genomics 15, 850. - PMC - PubMed
    1. Ashbrook DG, Delprato A, Grellmann C, Klein M, Wetzel R, Overall RW, and Badea A (2014b). Transcript co-variance with Nestin in two mouse genetic reference populations identifies Lef1 as a novel candidate regulator of neural precursor cell proliferation in the adult hippocampus. Front Neurosci 8, 418. - PMC - PubMed

Publication types

LinkOut - more resources